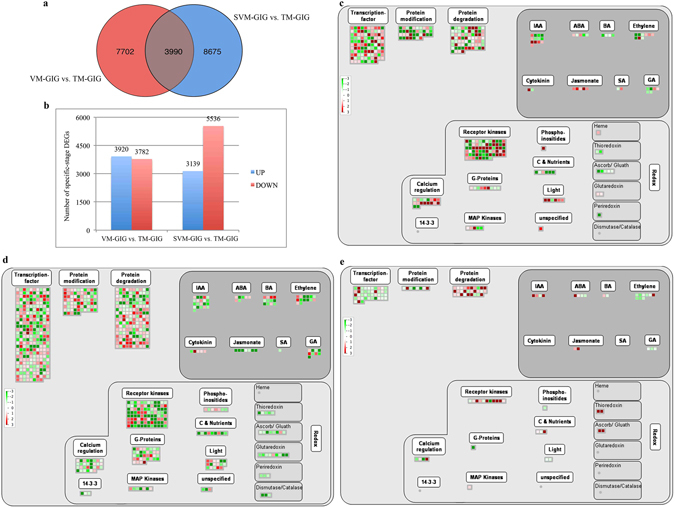
Figure 2.

Number of DEGs and MapMan regulation overview maps in each comparison. (a) Number of conserved and stage-specific expression DEGs in pairwise comparisons of GIG. (b) Stage-specific comparison of DEGs in GIG. (c) MapMan regulation overview maps showing the transcript levels of stage-specific DEGs in the VM-GIG vs. TM-GIG comparison. (d) MapMan regulation overview maps showing the transcript levels of stage-specific DEGs in the SVM-GIG vs. TM-GIG comparison. (e) MapMan regulation overview maps showing the transcript levels of DEGs in the VM-OB vs. TM-OB comparison. The color indicates log2 value of fold changes, green color represents down-regulated transcripts, and red color represents up-regulated transcripts.
