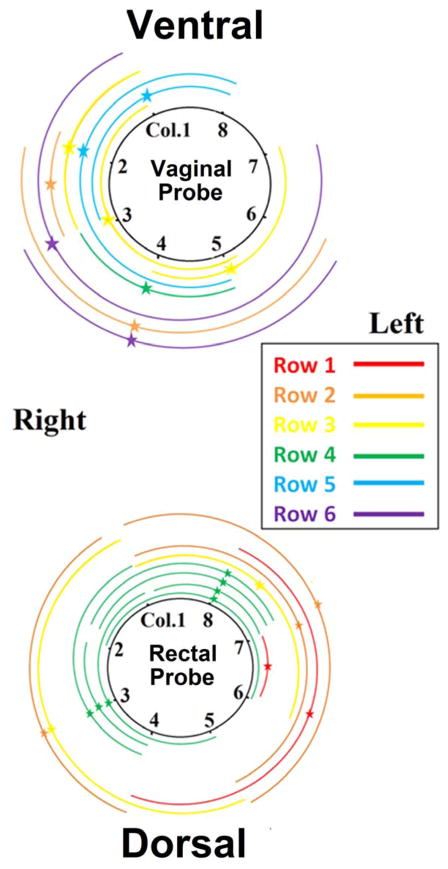
Figure 5.
shows an example of the mapped IZ distributions and MUAP propagations of one subject. Each arc represents one MU. The star represents the location of the IZ and the two arms extending from the IZ represent the propagation of the MUAP. Depth of MUAP and IZ is indicated by the arc color. The distance of each arc to the circle is only for displaying purpose and has no physical meaning.

