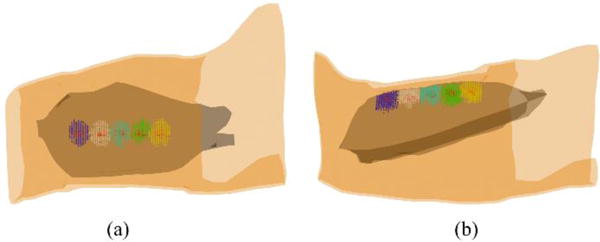
Fig. 4.

(a) Top view and (b) side view of the distributions of the IZs reconstructed from simulated surface EMG signals with the source depth of 15mm and the SNR of 25 dB. Red dots represent the simulated target IZs and blue, white, light blue, green, and yellow dots represent the reconstructed IZs at different locations of the biceps.
