Figure 1.
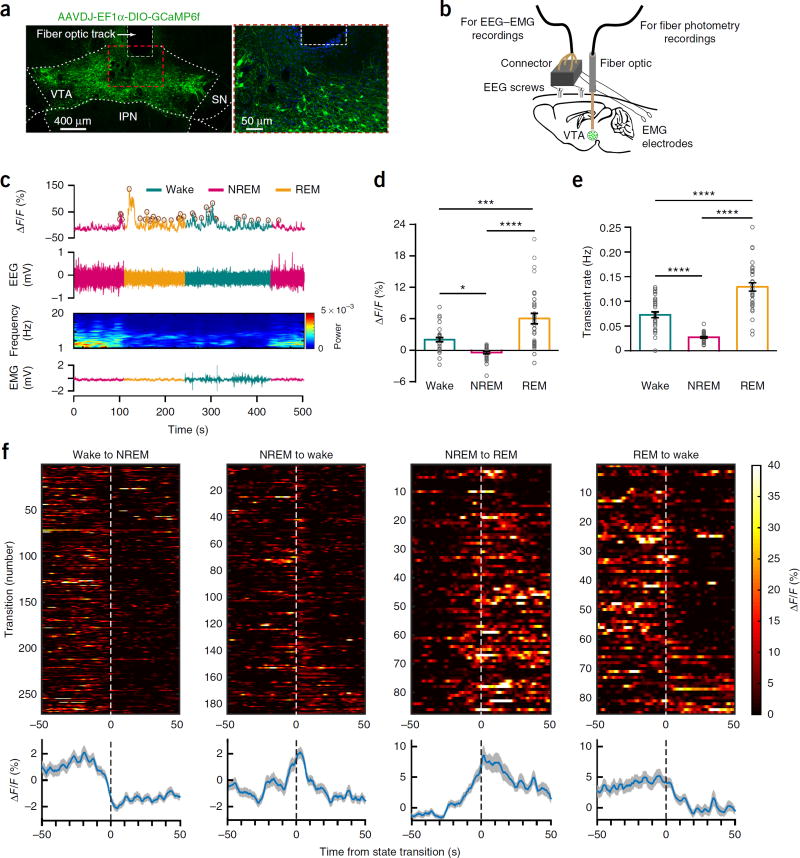
Population activity of Th+ VTA neurons across sleep–wake states, (a) Representative images of the VTA from a GCaMP6f-expressing mouse, showing viral expression and the placement of the tip of the fiber above the VTA (one of four mice), (b) Schematic of the in vivo recording configuration, (c) Representative fluorescence trace, EEG, EEG power spectrogram and EMG trace across spontaneous sleep–wake states. ΔF/F, change in fluorescence from median of the entire time series. Brown circles, transients detected using a filtering-based algorithm. (d,e) Mean ± s.e.m. fluorescence (d) and transient rate (e) during wake, NREM sleep and REM sleep (n = 4 mice, 8 sessions per mouse; two-way repeated-measures (RM) ANOVA between arousal state and mice, arousal state: F2,14 = 36.95 (fluorescence) and 89.26 (transient rate), P = 2.6 × 10⁻⁶ (fluorescence) and 1.08 × 10⁻⁸ (transient rate); followed by Tukey’s post hoc tests, *P= 0.015, ***P=3 × 10⁻⁴, ****P= 1 × 10⁻⁶ (fluorescence) and ****P(wake-NREM) = 9 × 10⁻⁵, (wake–REM) = 9 × 10⁻⁶ and (NREM–REM) = 6 × 10⁻⁹. (f) Fluorescence aligned to arousal state transitions. Top, individual transitions with color-coded fluorescence intensity (wake-NREM, n = 254; NREM-wake, n = 172; NREM–REM, n=86; REM-wake, n = 84). Bottom, average responses from all the transitions expressed as mean (blue trace) ± s.e.m. (gray shading). Trials in top panel are sorted by the duration of the second state (shortest, top; longest, bottom).

