Figure 6.
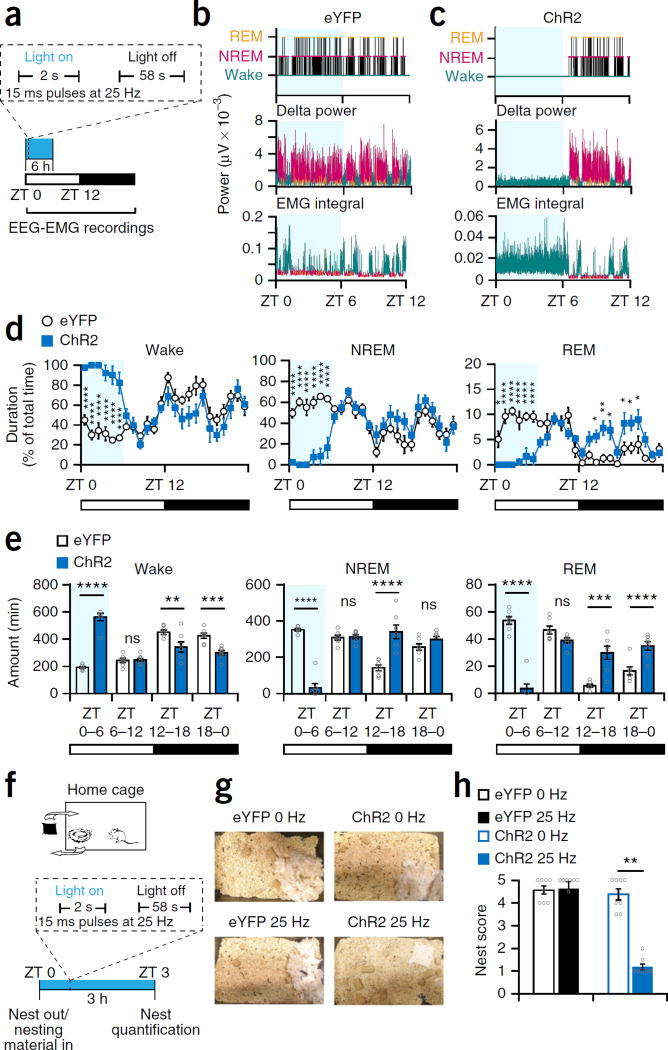
Optogenetic activation of Th+ VTA neurons is sufficient to maintain wakefulness and suppress nest-building behavior. (a) Diagram of stimulation protocol. (b,c) Representative hypnogram, fast Fourier transform–derived delta power and EMG activity over the 12 h of the nactive, light phase in (b) an eYFP and (c) a ChR2 mouse. Light blue shading represents the stimulation phase. (d) Percent (mean ± s.e.m.) time spent awake (left), in NREM sleep (middle) and REM sleep (right) during 24 h, starting with the photostimulation (n = 7 per group; two-way RM ANOVA between time and viral transduction, interaction: F23,138 = 11.65 (wake), 10.38 (NREM), and 12.18 (REM), P = 1 × 10⁻¹⁵ for wake, NREM and REM sleep; followed by Sidak’s post hoc tests, Wake: P(ZT 0) = 3 × 10⁻⁶, P(ZT 1) = 3 × 10⁻¹⁰, P(ZT 2) = 4 × 10⁻⁹, P(ZT 3) = 5 × 10⁻⁸, P(ZT 4) = 5 × 10⁻⁹, P(ZT 5) = 1 × 10⁻⁶; NREM: P(ZT 0) = 3 × 10⁻⁶, P(ZT 1) = 1 × 10⁻⁹, P(ZT 2) = 3 × 10⁻⁸, P(ZT 3) = 1 × 10⁻⁷, P(ZT 4) = 9 × 10⁻⁹, P(ZT 5) = 4 × 10⁻⁶; REM: P(ZT 0) = 0.02, P(ZT 1) = 1 × 10⁻⁷, P(ZT 2) = 3 × 10⁻⁹, P(ZT 3) = 8 × 10⁻⁶, P(ZT 4) = 2 × 10⁻⁵, P(ZT 5) = 5 × 10⁻⁶, P(ZT 14) = 0.025, P(ZT 15) = 0.003, P(ZT 16) = 0.01, P(ZT 18) = 0.03, P(ZT 19) = 0.03, P(ZT 20) = 0.03. (e) Duration (mean ± s.e.m.) per 6-h bin; n = 7 per group; two-way RM ANOVA between time and viral transduction; interaction: F3,36 = 54.92 (wake), 81.64 (NREM), and 56.8 (REM), P = 1.6 × 10⁻¹³ (wake), 1 × 10⁻¹⁵ (NREM), and 9.9 × 10⁻¹⁴ (REM). (f) Diagram of experiment. (g) Representative pictures of the cages of eYFP and ChR2 mice at the end of the 3-h stimulation period at 0 Hz and 25 Hz (one of eight each). (h) Nesting score (mean ± s.e.m.); n = 8 mice per group, Wilcoxon matched-pairs signed rank test; eYFP: W = 0, P = 0.99; ChR2: W = −36, **P = 0.0078.

