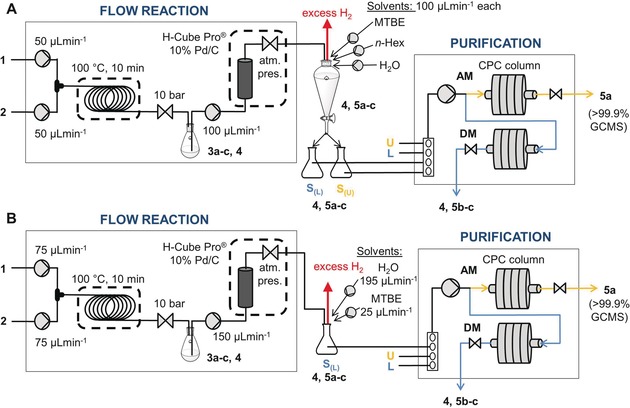
Figure 3.

Flow chart of the two‐step synthesis followed by a quasi‐continuous MDM CPC purification using A) a two‐phase sample intake or B) a one‐phase sample intake. U=upper phase of the chosen BLS, L=lower phase of the chosen BLS, S(L)=sample solution in the lower phase, S(u)=sample solution in the upper phase.
