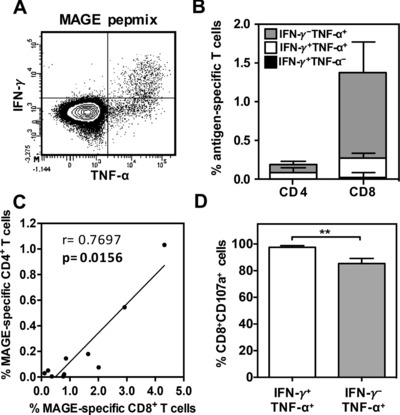
Figure 2.

Effector function of MAGE‐A‐specific CD4+ and CD8+ T cells stimulated with overlapping 15mer peptides. IFN‐γ and TNF‐α production was assessed on both CD4+ and CD8+ T cells by intracellular cytokine staining following restimulation with overlapping peptides in a cohort of patients demonstrating a positive IFN‐γ ELISPOT (n = 10). (A) A representative flow cytometry density plot demonstrating the gating strategy used to determine the subset of IFN‐γ+TNF‐α−, IFN‐γ−TNF‐α+ and IFN‐γ+TNF‐α+ T cells following pepmix stimulation is shown. (B) The mean proportion of CD4+ and CD8+ T cells within each cytokine subset was determined and is represented as a percentage of the total CD4+ or CD8+ T‐cell pool. Error bars represent SEM. (C) The correlation between the proportion of cytokine‐secreting CD4+ T cells and CD8+ T cells. Each symbol represents an individual patient and spearman's rank correlation coefficient (r) and significance (p) are reported. (D) The proportion of CD107a‐expressing CD8+ T cells within subsets of IFN‐γ+TNF‐α+ and IFN‐γ−TNF‐α+ cells in response to peptide stimulation. All data excluding (A) are pooled from 10 independent experiments. Data shown as mean + SEM. Data analyzed by Mann–Whitney test, **p < 0.01.
