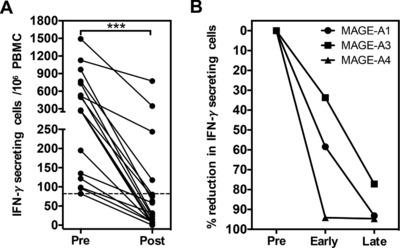
Figure 4.

Longitudinal analysis of the global CTAg‐specific T‐cell response in patients with testicular cancer. (A) The frequency of MAGE‐A‐specific T cells was measured by IFN‐γ ELISPOT before (Pre) and after the completion of adjuvant therapy (Post; ≥6 months) for a cohort of seminoma patients in whom a positive response to MAGE‐A1, ‐A3, and/or ‐A4 had been detected prior to treatment, and where a post‐treatment sample was available. A total of 18 MAGE‐A responses from 10 patients were assayed in duplicate. (B) The percent reduction of MAGE‐specific T cells at two timepoints (Early, <3 months; Late, ≥6 months) after treatment, relative to the pre‐treatment (Pre) frequency. Data analyzed by Wilcoxon matched‐pairs signed‐rank test, ***p < 0.001.
