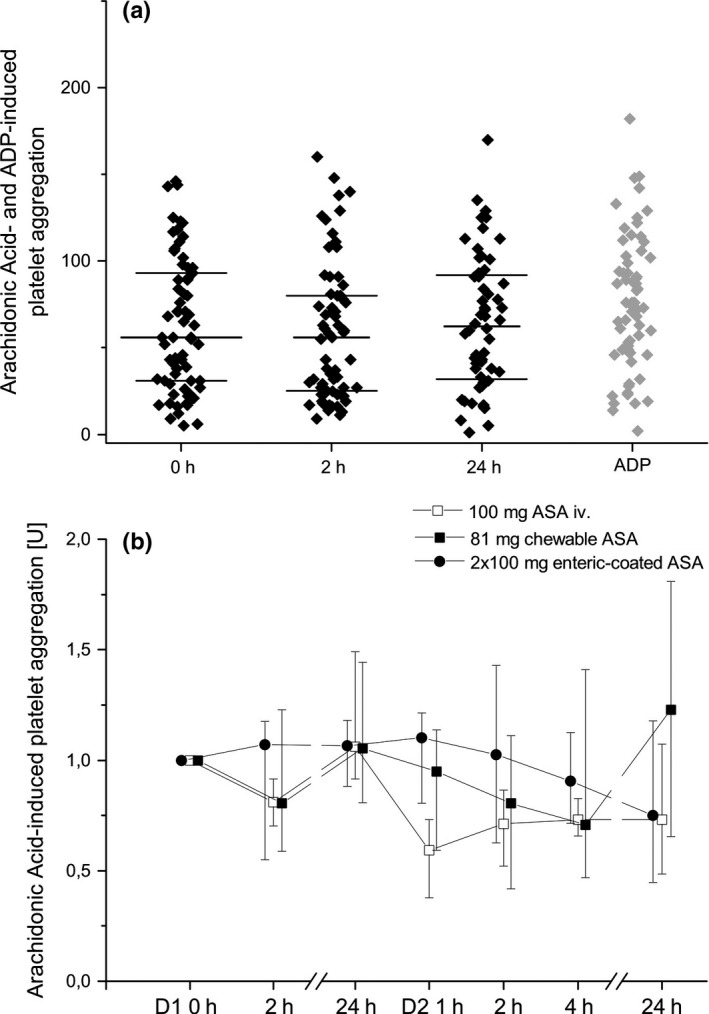
Figure 2.

Arachidonic acid‐ and ADP‐induced platelet aggregation using whole‐blood aggregometry. Panel (a) Arachidonic acid‐induced platelet aggregation during screening, individual values (dots), median and quartiles (horizontal lines) Panel (b) Relative changes in arachidonic acid‐induced platelet aggregation at baseline and after 100 mg intravenous, 100 mg enteric‐coated acetylsalicylic acid (ASA) bid or 81 mg chewable ASA, presented are medians ± interquartile ranges; 0 h or D1 0 h = before intake or infusion of Aspirin, 1 h = 1 h after intake or infusion, 2 h = 2 h after intake or infusion, 4 h = 4 h after intake or infusion, 24 h = 24 h after intake or infusion of ASA.
