
Figure 1.
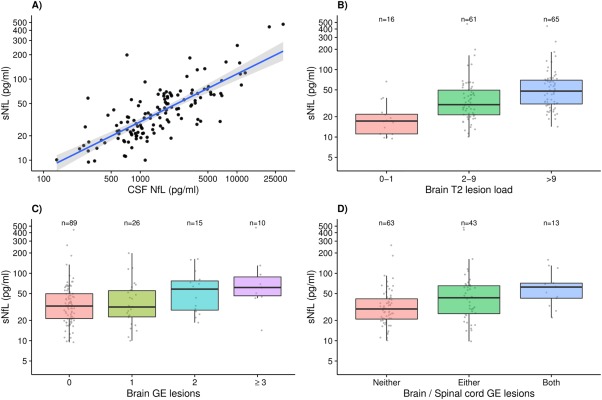
(A) Association between cerebrospinal fluid (CSF) neurofilament light chain (NfL) and serum neurofilament light chain (sNfL) levels in the Lugano cohort. A 10% increase in CSF NfL corresponds to an increase of approximately 5.9% in sNfL (β = 0.589, p < 0.001). Gray band: 95% confidence interval. (B) Association between brain T2 lesion load and sNfL levels in the Lugano cohort (2–9 vs 0–1: β = 1.849, p = 0.001; >9 vs 0–1: β = 2.524, p < 0.001). (C) Association between number of brain gadolinium‐enhancing (GE) lesions and sNfL levels in the Lugano cohort (1 vs 0: β = 1.077, p = 0.630; 2 vs 0: β = 1.551, p = 0.024; ≥3 vs 0: β = 2.138, p = 0.001). (D) Association between brain and spinal cord GE lesions and sNfL levels in the Lugano cohort (either brain or spinal vs neither: β = 1.461, p = 0.005; both brain and spinal vs neither: β = 1.902, p = 0.002).