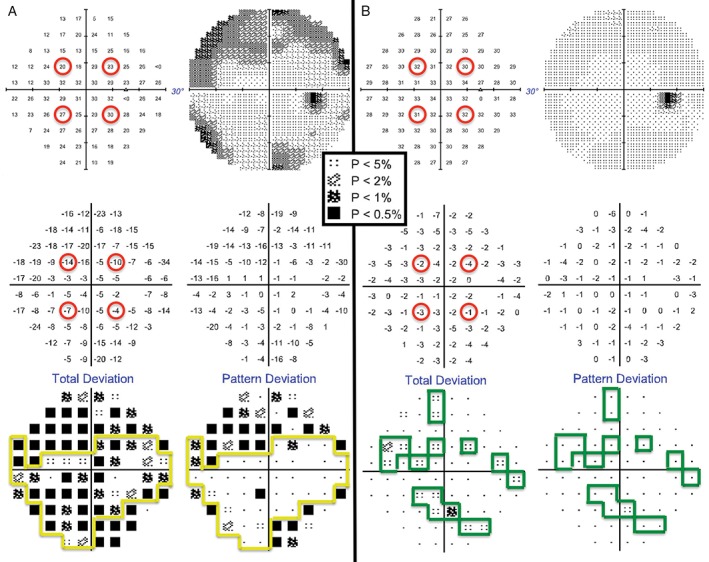
Figure 1.

The right eye Humphrey Field Analyzer (HFA) 30–2 SITA‐Standard visual field results for a 13‐year‐old Asian female (top left: thresholds [dB]; top right: greyscale; middle left: difference in dB from normative database; middle right: difference in dB from normative database after subtracting the patient's Hill of Vision [HoV]; bottom left: ‘Total Deviation’ plot, based on the values in the middle left, with probability scale of normality; bottom right: ‘Pattern Deviation’ plot, based on the values in the middle right with probability scale of normality). It was the first time she had undertaken visual field testing (A) and she did not have a good understanding of the task, leading to errors in establishing the initial HoV with the four seeding points (upper left, middle left). After practice and improved task understanding, thresholds at the four seeding locations improved (B). Minor depressions of low significance only appeared in the ‘Total Deviation’ plot (B, lower left) and once the HoV was considered, there was a single significant defect on the ‘Pattern Deviation’ plot (B, lower right). A key for the greyscale levels of probability of normality is shown as an inset.
