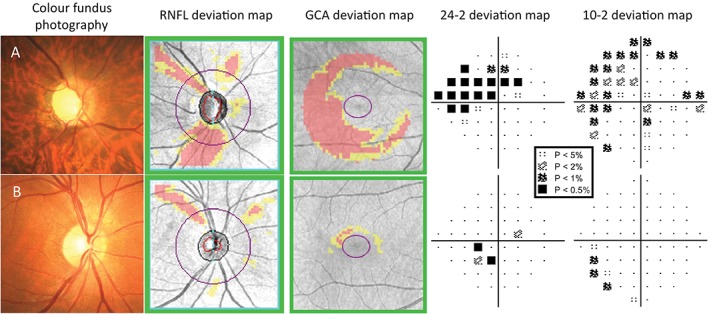
Figure 3.

Examples of patients where a 10–2 visual field has helped to determine the extent of the central visual field defect found on the 24–2 (Humphrey Field Analyzer [HFA] SITA‐Standard). A key for the greyscale levels of probability of normality is shown as an inset. (A) The right eye findings of a 54‐year‐old Asian man with moderate normal‐tension glaucoma. The disc size was average, with enlarged vertical cup. There was evidence of inferior neuroretinal rim thinning, with corresponding retinal nerve fibre layer (RNFL) loss on the deviation map and ganglion cell‐inner plexiform layer (GCIPL) thinning on the Ganglion Cell Analysis (GCA) deviation map. The 24–2 visual field showed a superior nasal step defect extending in an arcuate fashion, with points encroaching upon fixation. 10–2 visual field showed the central defect in greater detail, with reductions in sensitivity as near as one degree from fixation. (B) A 46‐year‐old Caucasian man with previous ischaemic attack resulting in superior RNFL loss, as seen in both the fundus photograph and the RNFL deviation map. Although the GCA deviation map showed little significant reduction in GCIPL thickness, the 24–2 visual field deviation map showed points of reduced sensitivity within 10 degrees of fixation. The 10–2 visual field showed that the reduction in sensitivity was located mainly seven to nine degrees from fixation and not within the central five degrees.
