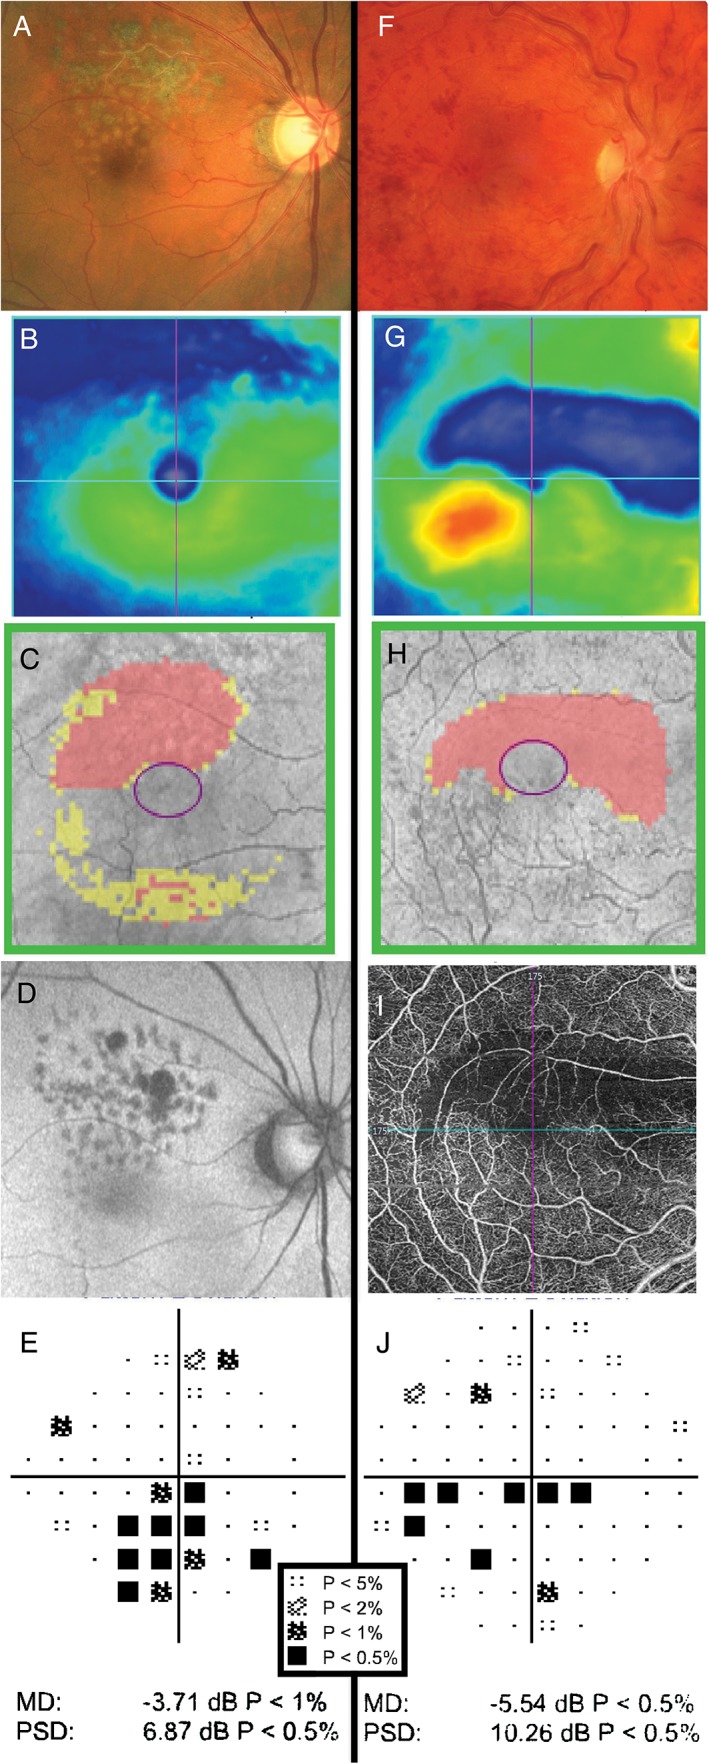
Figure 5.

Examples of retinal pathology causing visual field defects. (A–E) The clinical findings of a 68‐year‐old Asian man who had previously undergone retinopexy and intravitreal anti‐vascular endothelial growth factor injections for right branch retinal vein occlusion. The Cirrus optical coherence tomography (OCT) macular thickness heat map (B) and Ganglion Cell Analysis (GCA) deviation map (C) show reductions in neural tissue in the superior macular region. Autofluorescence (D) also highlights the area of atrophy. In (E), the pattern deviation map from the Humphrey Field Analyzer (HFA) 24–2 SITA‐Standard visual field shows structure‐function concordance with focal depressions in the inferior field. (F–J) The clinical findings of a 29‐year‐old Caucasian man with multiple previous retinal vein occlusions in the right eye secondary to Factor V Leiden hypercoagulability. Dilated fundus examination showed diffuse and widespread haemorrhages, dilated and tortuous retinal veins and optic disc oedema in the right eye (F). Cirrus OCT heat map showed oedema of the inferior macula and thinning of the superior macula (G). Similarly, the GCA deviation map showed thinning superiorly (H). OCT‐angiography imaging showed loss of underlying vasculature in the superior region of thinning, indicative of ischaemia (I). This explained the presence of a clear inferior visual field defect (HFA 30–2 SITA‐Standard) adjacent to fixation and thus structure‐function concordance (J). A key for the greyscale levels of probability of normality is shown as an inset.
