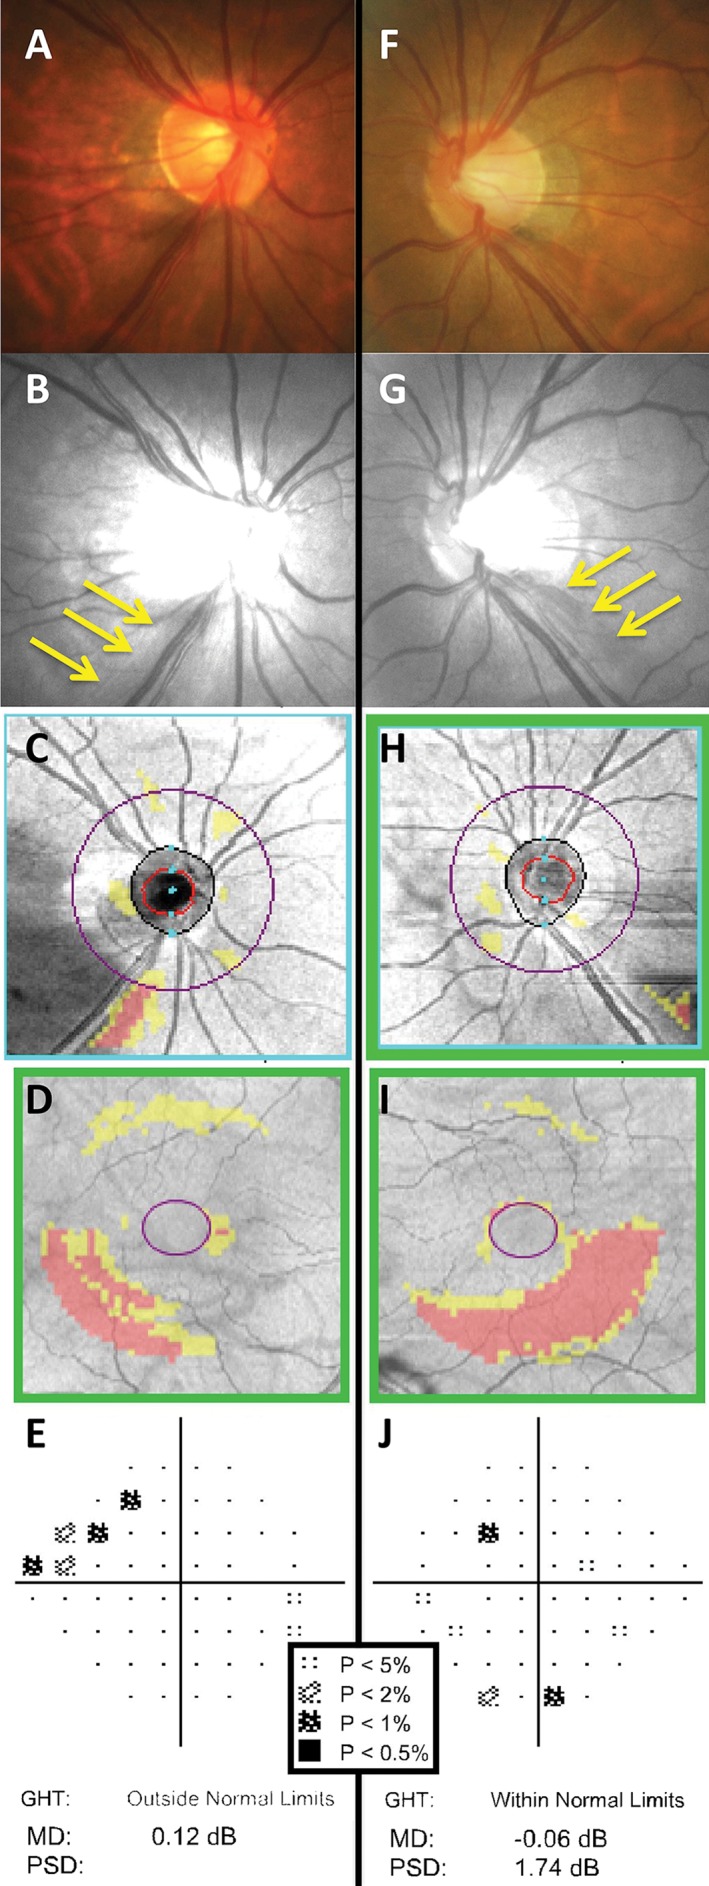
Figure 11.

The right (A–E) and left (F–J) eye clinical findings of a 60‐year‐old Asian woman with bilateral glaucoma. A key for the greyscale levels of probability of normality is shown as an inset. Optic nerve head examination showed small‐sized, tilted discs with inferotemporal thinning of the neuroretinal rim (A, F) and corresponding retinal nerve fibre layer (RNFL) loss in both eyes as shown by the yellow arrows (B, G). Cirrus optical coherence tomography (OCT) RNFL deviation map showed more obvious RNFL loss in the right eye (C) compared to the left (H), due to the presence of eye movement artefacts. Cirrus OCT Ganglion Cell Analysis (GCA) deviation map showed inferior arc‐shaped defects of ganglion cell‐inner plexiform layer loss, left (I) more so than right (D). Humphrey Field Analyzer (HFA) 24–2 SITA‐Standard deviation map results showed structural‐function correlation in the right eye, with a superior nasal step (E). The mean deviation (MD) score was 0.12 dB (p > 0.05), the pattern standard deviation (PSD) score was 2.02 dB (p < 0.05) and the Glaucoma Hemifield Test (GHT) was marked as ‘outside normal limits’. In comparison, there was no structure‐function correlation in the left eye, with only isolated points of reduced sensitivity (J). Global indices were also essentially within normal limits: MD score was −0.06 dB (p > 0.05), PSD score was 1.74 dB (p > 0.05) and the GHT was ‘within normal limits’.
