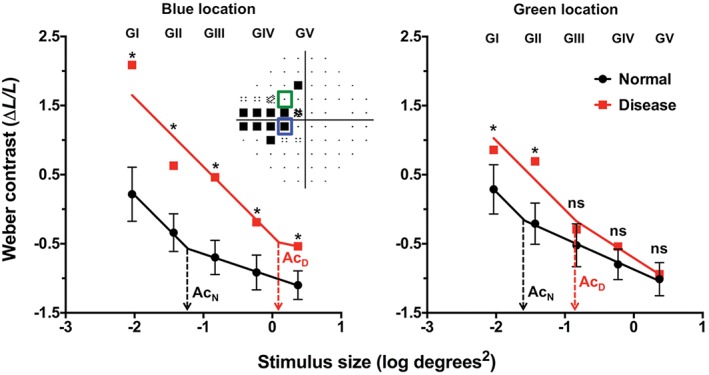
Figure 13.

Spatial summation functions for the same patient shown in Figure 12. Humphrey Field Analyzer (HFA) thresholds have been converted into equivalent Weber contrast levels on the y‐axis (as per Khuu and Kalloniatis5) with stimulus sizes expressed in log degrees2 on the x‐axis. Five points represent the thresholds obtained using each available Goldmann stimulus size on the HFA and the line represents the segmental non‐linear regression with an initial slope fixed at −1, representing the region of complete spatial summation. The dashed lines indicate the critical area (Ac) for normal (black, AcN) and disease (red, AcD) at the two representative locations. The red squares denote the thresholds of the patient with glaucoma and the black circles indicate a group of age‐equivalent normal patients (error bars denote the 95 per cent distribution limits). Two representative locations are shown, coloured coded according to the inset visual field pattern deviation map. For the blue test location, all sizes show a statistically significant elevation in threshold (marked with asterisks) but stimuli that are within complete spatial summation (that is, the slope of −1) have the greatest threshold elevation. For the green test location, only Goldmann sizes I and II had significant threshold elevation (*), while Goldmann sizes III–V were not significant (ns).
