
Figure 3.
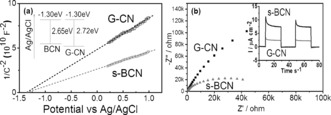
a) Mott–Schottky plots of G‐CN and s‐BCN at 1 kHz frequency (plots at other frequencies shown in the Supporting Information, Figure S8). b) Nyquist plots of G‐CN and s‐BCN obtained by applying a sine wave with amplitude of 5.0 mV over the frequency range from 10 kHz to 0.1 Hz, with the inset showing the periodic on/off photocurrent response of G‐CN and s‐BCN electrodes in 0.1 m Na2SO4 with 0 V bias versus Ag/AgCl.