Figure 4.

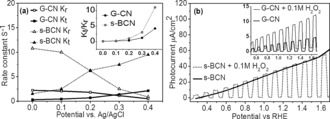
a) Potential dependence of the rate constant K t and K r for s‐BCN and G‐CN samples. Illumination: 365 nm UV light; b) photocurrent of G‐CN and s‐BCN (inset) with and without addition of 0.1 m H2O2, pH 5.7.

a) Potential dependence of the rate constant K t and K r for s‐BCN and G‐CN samples. Illumination: 365 nm UV light; b) photocurrent of G‐CN and s‐BCN (inset) with and without addition of 0.1 m H2O2, pH 5.7.