
Figure 3.
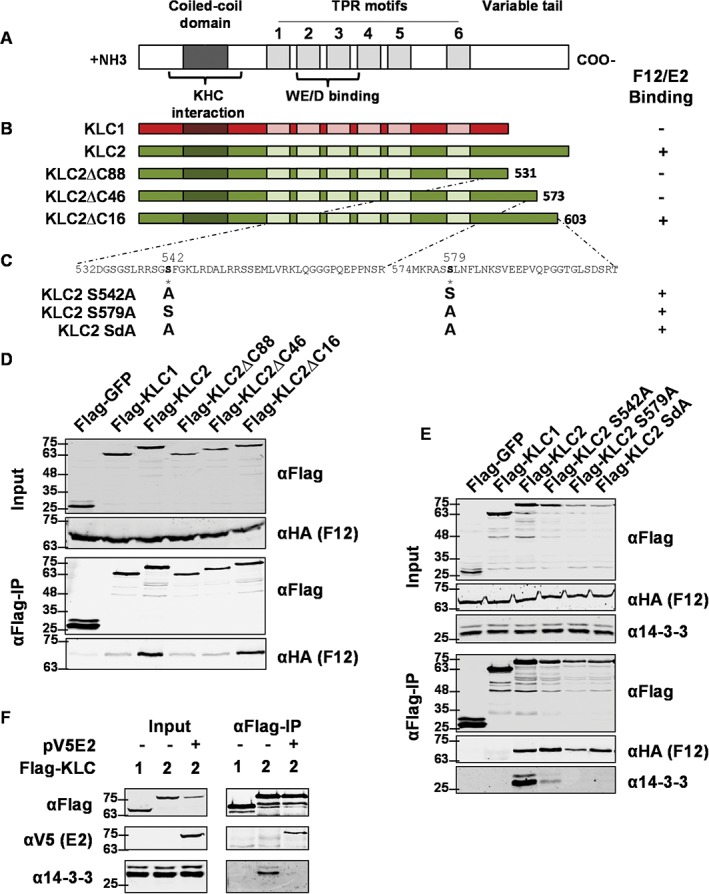
Detailed mapping of the F12/E2 interaction with the KLC2 C‐terminal tail. A, Schematic of KLC structural organization. The coiled‐coil domain, TPR motifs, WE/D interacting domain and C‐terminal variable tail are shown. B, Diagrammatic representation of KLC1 (red), KLC2 (green) and the C‐terminal mutants lacking the last 16, 46 or 88 amino acids. C, Sequence of the KLC2 region required for F12/E2 association. Serines 542 and 579 were mutated to alanine either individually (KLC2 S542A and KLC2 S579A) or together (KLC2 SdA). D, Co‐precipitation of F12 with KLCs. HEK293T cells were transfected with plasmids expressing FLAG‐tagged GFP, KLC1, KLC2 or KLC2 mutants described in panel (B). Cells were infected 24 h after transfection with vF12‐HA at 5 pfu/cell and 12 hpi FLAG‐tagged proteins were immunoprecipitated and analysed by SDS‐PAGE and immunoblotting with the indicated antibodies. Clarified lysates (Input) were analysed in parallel. The interaction of KLCs with F12/E2 is summarized to the right of panel (B). E, Immunoprecipitations and immunoblots were performed as for panel (D) using the mutant KLC2s described in panel (C) and the antibodies shown. The interaction of KLCs with F12/E2 is summarized to the right of panel (C). F, E2 blocks the association of 14‐3‐3 with KLC2. HEK293T cells were co‐transfected with plasmids expressing FLAG‐tagged KLC1 or KLC2 (as indicated) and plasmids expressing E2 or empty vector (EV). Immunoprecipitation and immunoblots were performed as for panel (D) using the antibodies shown. Panels D to F are representative of a minimum of 3 experiments each.