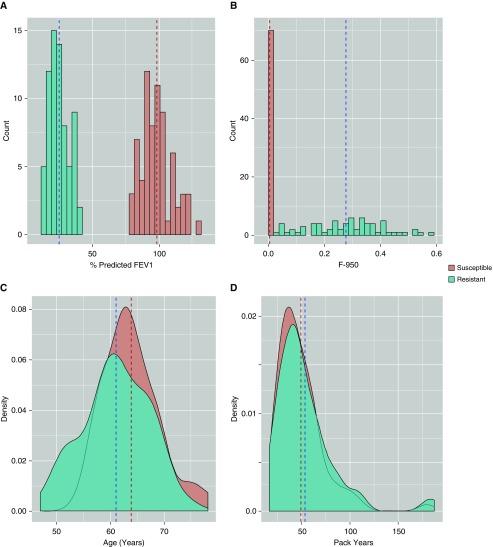
Figure 2.
Analyzed subcohorts represent clinical extremes in terms of obstruction as measured by (A) percent predicted FEV1 and (B) F-950 despite having very similar (D) smoking histories (pack-years) at a similar (C) age. Dashed lines represent subcohort means. F-950 = Hounsfield units value less than −950.

