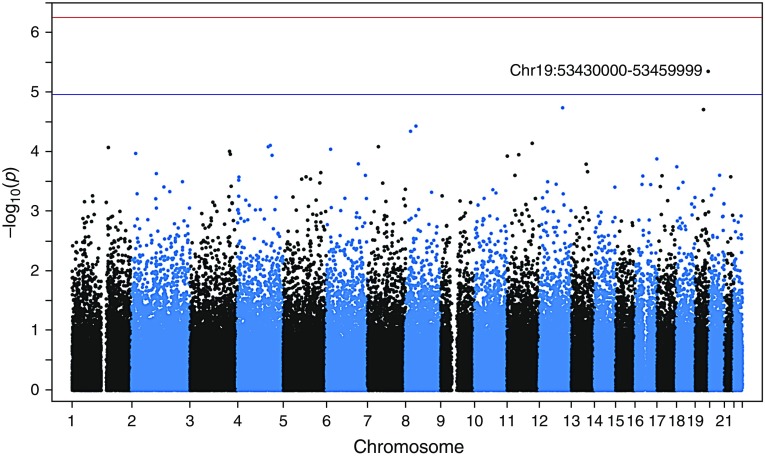
Figure 3.
Manhattan plot of 30-kb regions spanning the whole genome. Each dot represents a single 30-kb region and the strength of its association with emphysema is plotted on the y-axis. The top association at 19q31 is labeled. Other top associations are reported in Table 2. The top threshold represents genome-wide significant association (P ≤ 5.4 × 10⁻⁷), and the bottom threshold represents suggestive association (P ≤ 1.1 × 10⁻⁵) after Bonferroni correction.

