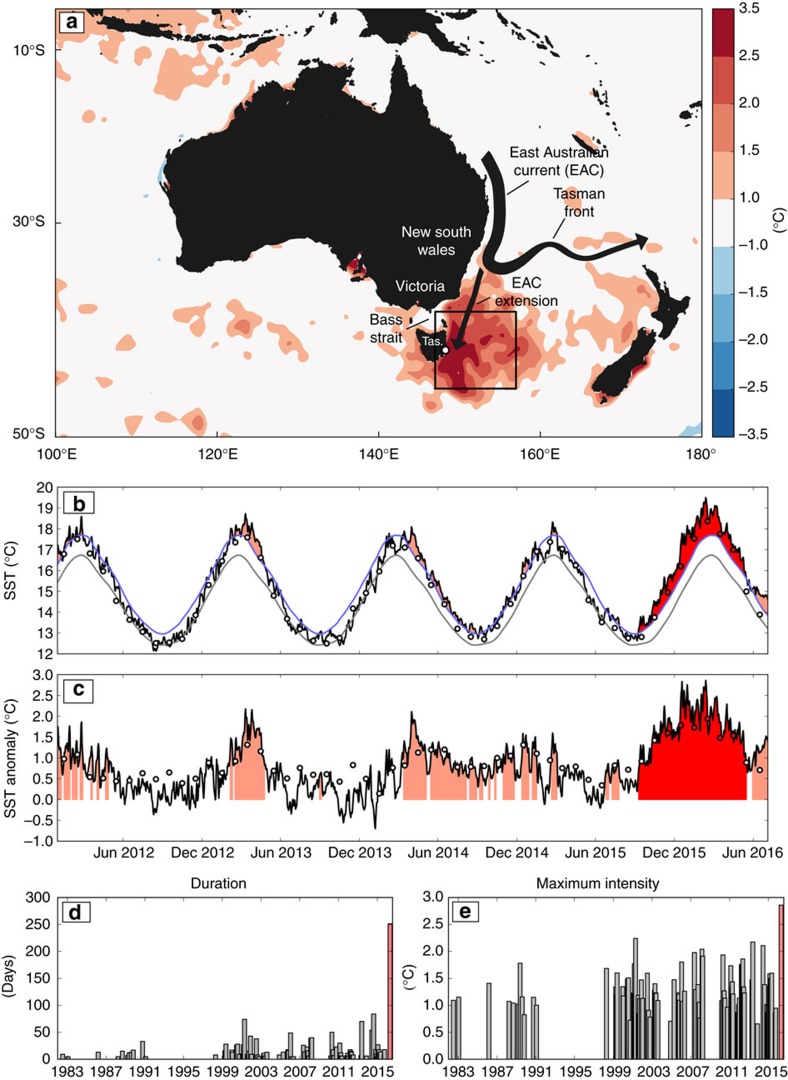
Figure 1. The 2015/16 MHW off southeast Australia.
(a) The mean 2015/16 austral summer (December to February) mean SST anomalies from NOAA OI SST, the box used to define the southeast Austraila (SEAus) region (black lines) and the location of the Maria Island Time Series (open circle). Anomalies are relative to the 1982–2005 climatology. Also shown are time series of (b) SST and (c) SST anomalies averaged over the SEAus region since 2012 from NOAA OI SST (black lines) and HadISST (circles). The red-filled circles in b,c indicate which months during the event were among the top ten on record since 1880. The grey and blue lines in b indicate the climatological mean and 90th percentile threshold, respectively, calculated from NOAA OI SST. The pink-shaded regions in b,c indicate all MHWs detected using the Hobday et al.2 definition and the red-shaded region is the 2015/16 event. The (d) duration and (e) maximum intensity are shown for this event as red bars along with values for all previous events on record back to 1982.

