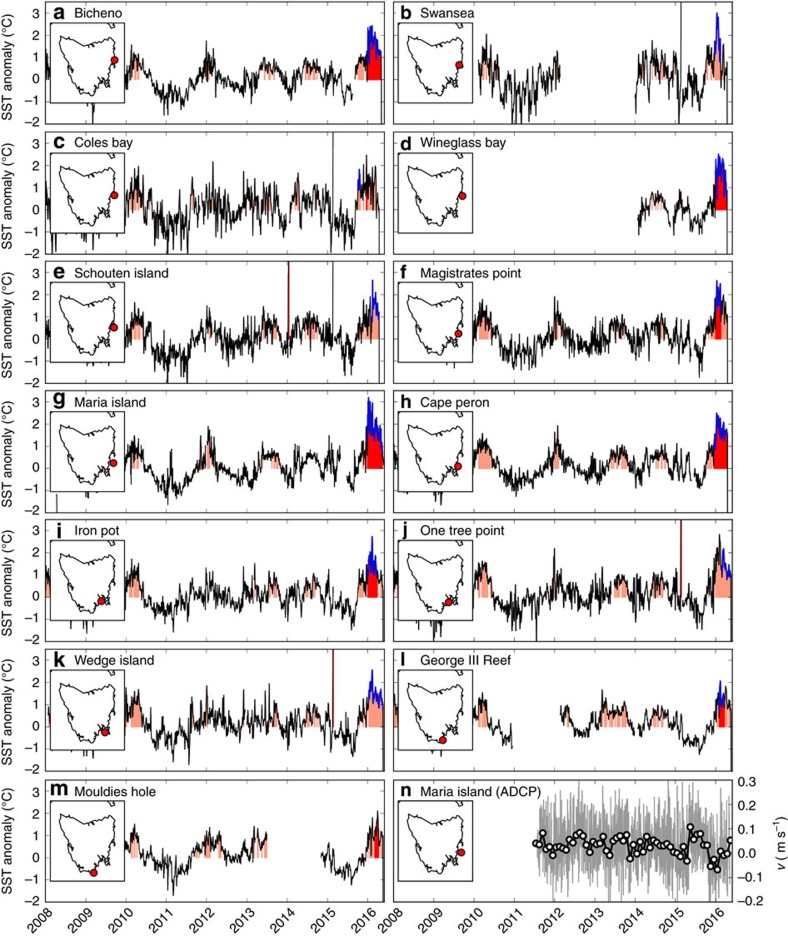
Figure 2. Near-shore temperature and velocity records around Tasmania.
(a–m) Temperature anomalies are shown for 13 sites along Tasmania’s eastern shelf. The shaded regions indicate each MHW detected using the Hobday et al.2 definition, the red-shaded region is the largest event (by maximum intensity) and the blue line indicates the longest event. (n) Depth-averaged meridional velocity measured with an Acoustic Doppler current profiler (ADCP) at the Maria Island Australian National Mooring location (daily means as grey line, monthly means as open circles).

