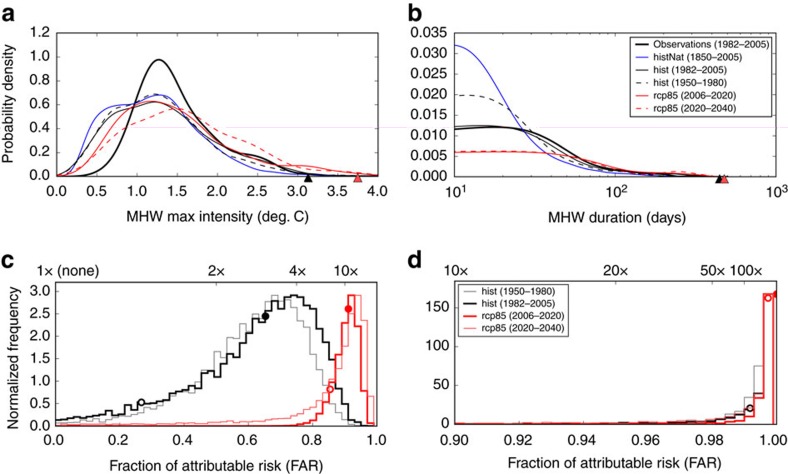
Figure 7. Attribution of the 2015/16 Tasman Sea marine heatwave event using global climate models.
The PDFs of the (a) maximum intensity and (b) duration of all MHWs detected from the observations (thick black line) and the ensemble of CMIP5 historical simulations over 1982–2005 (thin black line) and over 1950–1980 (dashed black line), historicalNat simulations (blue line), and RCP8.5 simulations over 2006–2020 (red line) and over 2020–2040 (dashed red line), using a baseline climatology of 1881–1910. The black and red triangles indicate the properties of the event being attributed and of the 2015/16 event, respectively. The distribution of FAR values for a MHW of (c) maximum intensity 3.1 °C or (d) duration of 446 days from the historical and RCP8.5 runs over four separate time periods. 1 × (None) indicates no change in likelihood. The best estimate (median) and 10th percentile FAR values are indicated for the 1982–2005 and 2006–2020 periods by filled and open circles, respectively.

