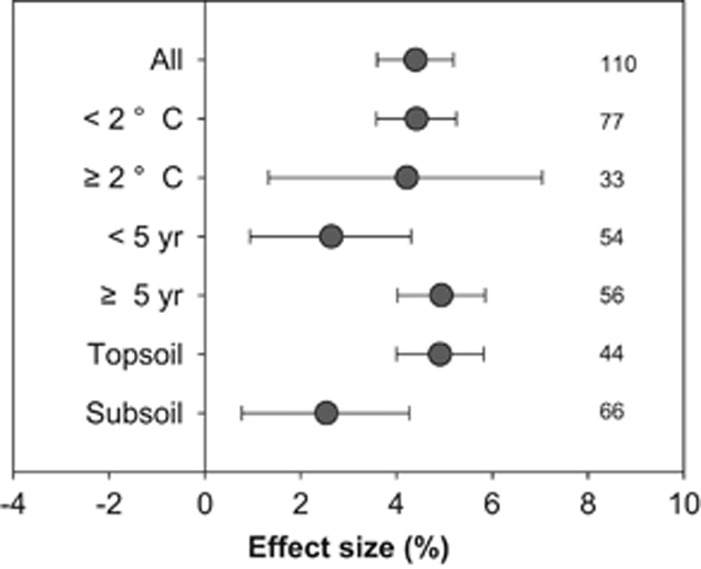
Figure 2.
Meta-analysis of warming effects on SOC changes along the soil depth profile in field studies across the globe. The numbers of observations for all independent observations (‘All’, n=110) and other categories are shown in the figure. Observations were grouped into temperature elevations (< 2 vs ⩾2 °C), experimental durations (< 5 vs ⩾ 5 years) and different soil layers (topsoil vs subsoil). Data obtained on the mean effect sizes  were reported as percentage changes under warming (that is, 100 × (|R-1|)). The warming effect was deemed significant if the 95% confidence intervals did not overlap with 0.

