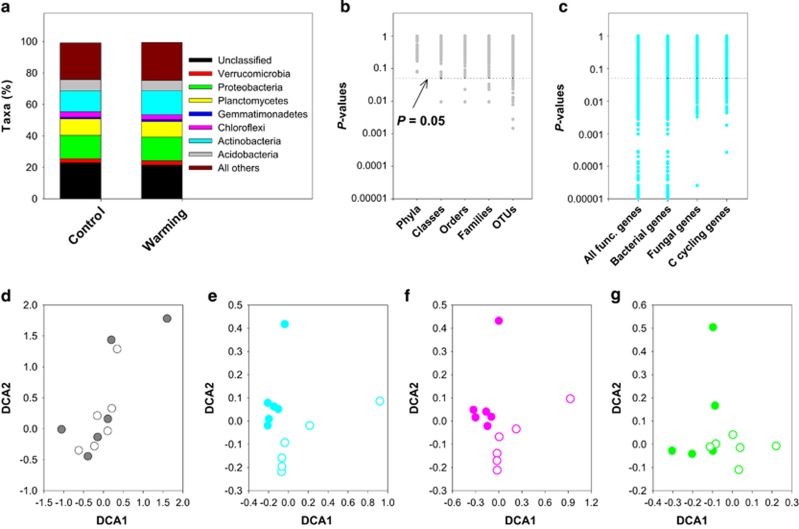
Figure 3.
Effects of warming on taxonomic and functional profiling of microbial communities in subsoil in the Oklahoma site. (a), Relative abundances of dominant phyla (>1% 16S rRNA gene data sets). (b), P-values of warming effects on the relative taxon abundances at different taxonomic levels (16S rRNA gene). (c), P-values of warming effects on all, bacterial, fungal and C cycling functional genes (gene profiles of GeoChip). Data points below the horizontal line in (b) and (c) indicate a statistically significant effect of warming (P⩽0.05). (d–g), DCA ordination of the structure of microbial communities: taxonomic profiles of bacterial communities based on 16S rRNA genes (d), functional profiles of microbial communities based on all functional genes in GeoChip (e), functional profiles of bacterial (f) and fungal (g) communities based on GeoChip. Warming, filled circles. Control, unfilled circles.

