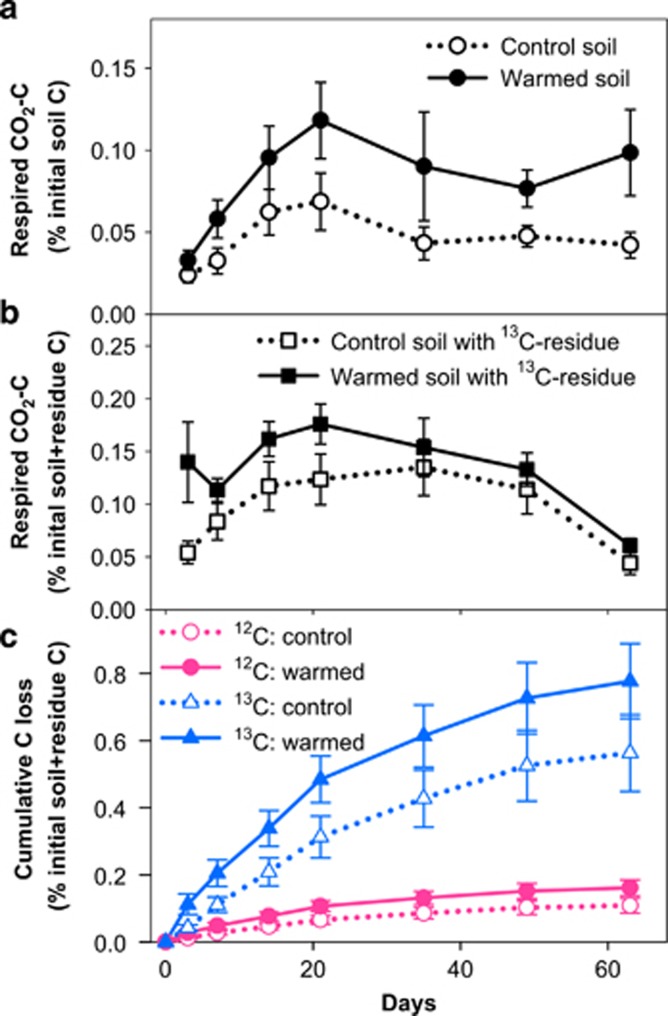
Figure 4.
Decomposition by microbial communities in warmed and control soils: a SIP microcosm experiment. Data are means (n=6)±s.e.m. The y axis denotes the percentage of respired C on the basis of the initial total soil (a) or total soil and residue (b and c) C contents. (a), Respired CO2 from warmed (filled circles) and control (unfilled circles) soils. Warming, P<0.01; time, P<0.01; warming × time, P=0.35; repeated measures ANOVA. (b), Respired CO2 from warmed (filled circles) and control (unfilled circles) soils amended with 13C-labeled residues. Warming, P<0.01; time, P<0.01; warming × time, P=0.63; repeated measures ANOVA. (c), Cumulative C loss by microbial respiration from warmed (solid lines) and control (dotted lines) soils. Red circles: 12C, soil-derived C. Blue triangles: 13C, residue-derived C.

