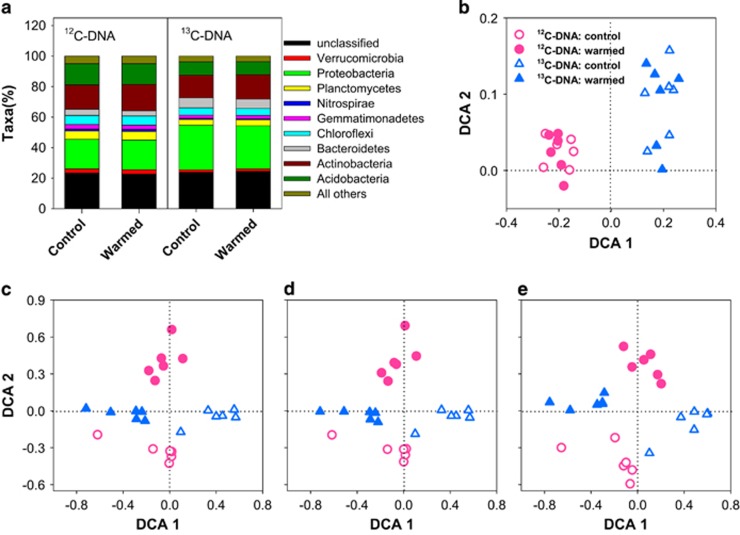
Figure 5.
Taxonomic and functional structures of microbial communities in warmed and control soils in the SIP microcosm experiment. (a), Relative abundances of dominant phyla (>1% 16S rRNA gene). 12C-DNA, total communities, light fractions isolated during SIP. 13C-DNA, active communities, heavy fractions isolated during SIP. (b–e), Taxonomic (b, 16S rRNA gene) and functional (c–e; GeoChip) structures of total (12C-DNA; red circles) and active (13C-DNA; blue circles) microbial communities. (b), Bacterial communities of 16S gene. (c), All functional genes in GeoChip. (d), Functional genes targeted for bacteria. (e), Functional genes targeted for fungi. Warmed soils, filled symbols. Control soils, unfilled symbols.

