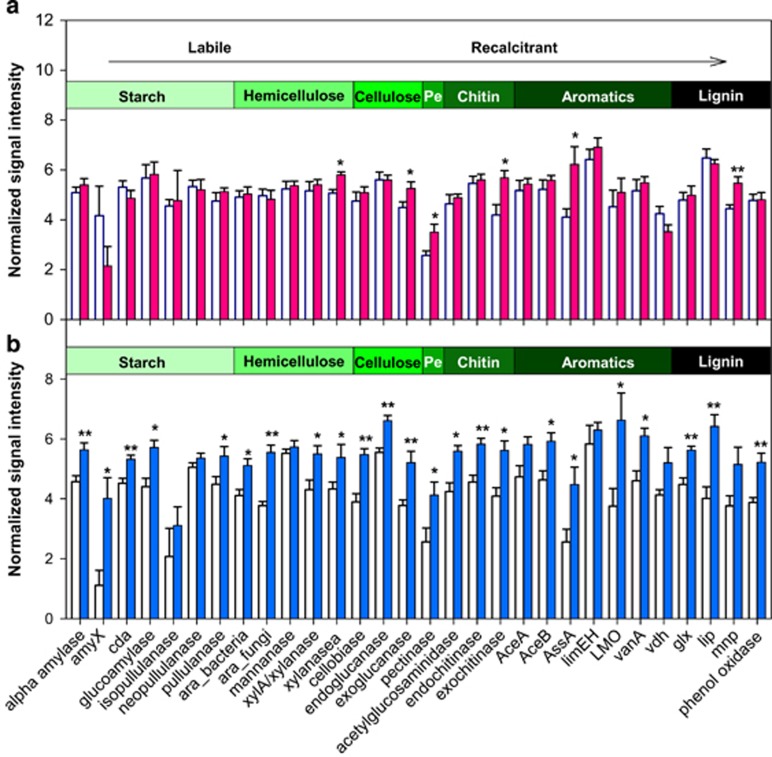
Figure 6.
Key C degradation genes in warmed and control soils in the SIP microcosm experiment. (a), 12C-DNA, total communities, light fractions isolated during SIP. (b), 13C-DNA, active communities, heavy fractions isolated during SIP. Warmed soils, filled bars. Control soils, blank bars. Signal intensities were the average abundances of detected genes. Organic compounds shown in the horizontal bars are typical in soil and/or plant residues. Pe, an abbreviation of ‘pectin’. The arrow denotes the increasing chemical recalcitrance of organic compounds. *P⩽0.05) and **P⩽0.01) are statistically significant effects of warming.

