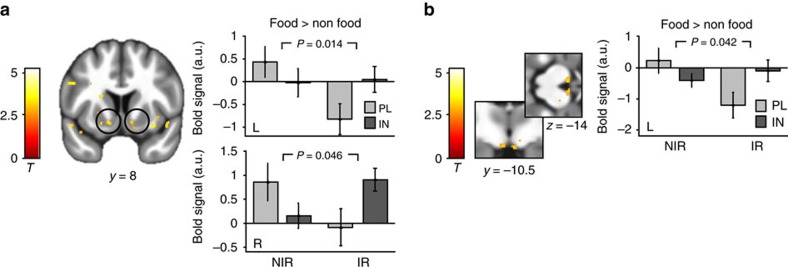
Figure 5. Neural insulin effects.
General linear modelling of value signals from the placebo and the insulin session revealed group by session interactions in the bilateral NAc (a) and the left VTA (b). In both regions, food value signals were decreased in the insulin session only in NIR, while signals were increased under INI in IR. Bar plots show group means and s.e.m. of mean contrast estimates extracted from ROIs from the comparison NIRPL>IN > IRPL>IN. Displayed P-values are FWE corrected for bilateral masks. Activations are overlaid on the mean structural image of all participants (display threshold P<0.005 uncorrected).

