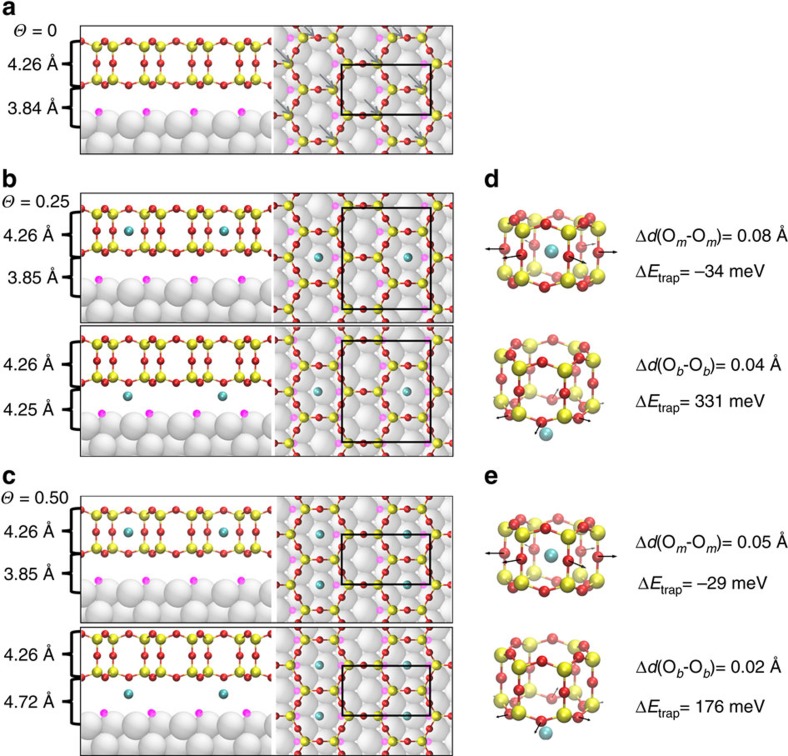
Figure 4. Geometric structures and calculated trapping energies.
Side (left) and top (right) views of relaxed structures of (a) silica bilayer before Ar trapping ((SiO2)8/4O/Ru(0001)), (b) Ar-(SiO2)16/8O/Ru(0001) with an Ar coverage of 0.25, where Ar is trapped in the cages ( =0.25) or at the interface (
 =0.25) and (c) Ar-(SiO2)8/4O/Ru(0001) with an Ar coverage of 0.50, where Ar is trapped in the cages (
 =0.50) or at the interface (
 =0.50). Black rectangles represent the unit cell. Distances on the left correspond to the thickness of the silica film (dz(Ot-Ob)) and the interfacial distance (dz(Ru-Ob)). Grey arrows in top view of (a) indicate the location of chemisorbed oxygen atoms underneath silicon atoms (two per unit cell). Changes in cage structures and trapping energies
  of the silica films upon Ar trapping in the cages and at the interface are shown in d,e respectively. Colour code: Si (yellow), O in the silica film (red), O chemisorbed on Ru(0001) (pink), Ru (silver) and Ar (cyan).

