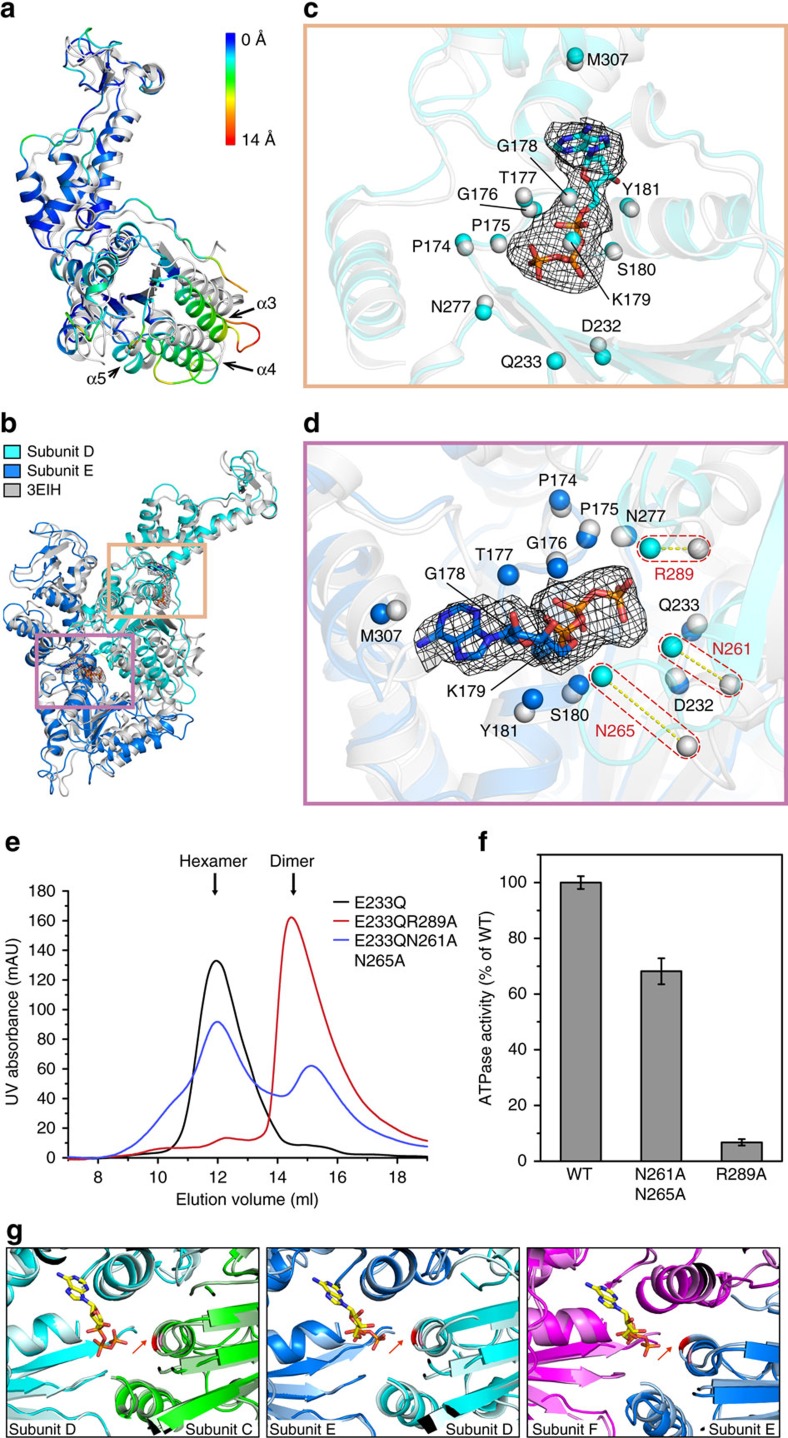
Figure 3. ATPase active centres.
(a) Comparison of subunit D with the crystal structure of the ATPγS-bound Vps4E233Q (PDB ID: 3EIH)12. The crystal structure is coloured grey, and the subunit D is coloured based on the distances between aligned Cα atom pairs with colouring scheme showing on the right. Helixes α3, α4 and α5 are labelled and marked by black arrows. (b) A focused view of the adjacent Vps4E233Q subunits D and E with each subunit superimposed with the crystal structure of the ATPγS-bound Vps4E233Q. Two ATPase active centres are boxed and detailed in (c,d). ATP molecules are shown in stick representation, and the map density shown in mesh. (c,d) Close-up views of the ATPase active centre in subunit D (c) and subunit E (d). Residues contributing to ATP binding are shown in sphere representation. Large shifts of R289, N261 and N265 in subunit D compared with those in the crystal structure are shown by red dashed boxes in (d). The orientations of all close-up views are optimized to show the positions of the residues contributing to ATP binding. All alignments were done using the residues in Walker A loop (Phe174-Tyr181), Walker B (Asp232-Gln233), sensor 1 (Asn277) and M307 as a reference. (e) SEC analyses of the oligomeric states of the Vps4 mutants. (f) The ATPase activity assays. Data are represented as the average of three independent experiments. Error bars represent s.d. (g) Comparison of the ATPase centres of Vta1-free and Vta1-bound Vps4E233Q hexamers. The colouring scheme is the same as in Fig. 1c,e. The ATP molecules in the Vta1-bound Vps4E233Q hexamers are displayed in stick model. The R289 residues (red arrows) in Vta1-free and Vta1-bound Vps4E233Q hexamers are coloured by pink and red, respectively. All alignments were performed using the subunits that the arginine fingers act on in trans.

