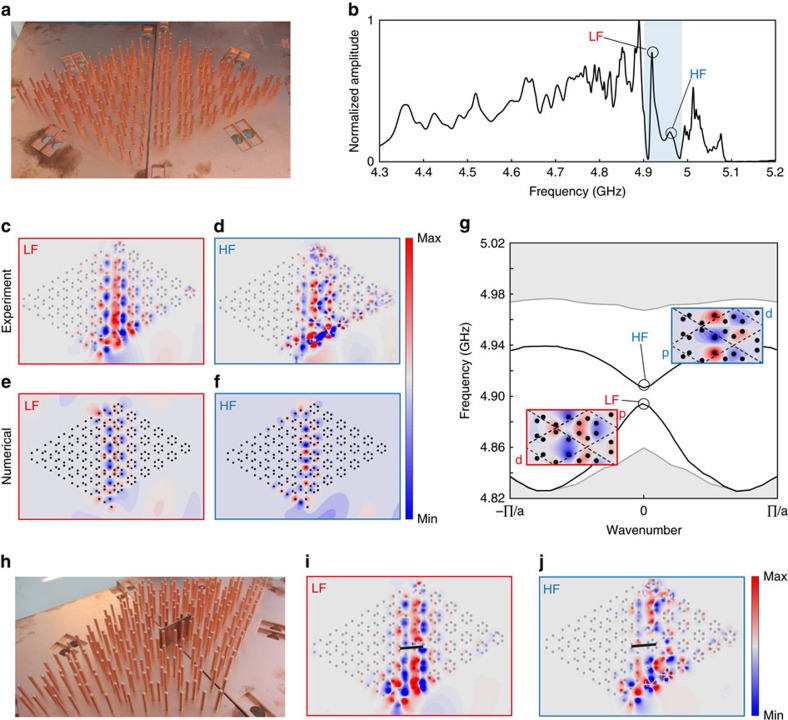
Figure 4. Experimental observation of topological edge modes guided at the subwavelength scale.
(a) We form a boundary between the topologically trivial sample and the topologically nontrivial one. (b) Spectrum of the field amplitude measured in the sample, averaged along the boundary. Two peaks appear in the band gap corresponding to a low frequency (LF) and a high frequency edge mode (HF). (c,d) Experimental electric field maps for the LF and HF edge modes. (e,f) Corresponding field maps computed from a coupled-dipole semi-analytical model. (g) Corresponding dispersion diagram for the edge modes, shown in inserts. (h) We insert a defect in the form of a large conducting wall placed right on the boundary. (i,j) Measured electric field maps in the presence of a defect, showing good robustness of the edge modes despite the breaking of sixfold rotational symmetry along the interface.

