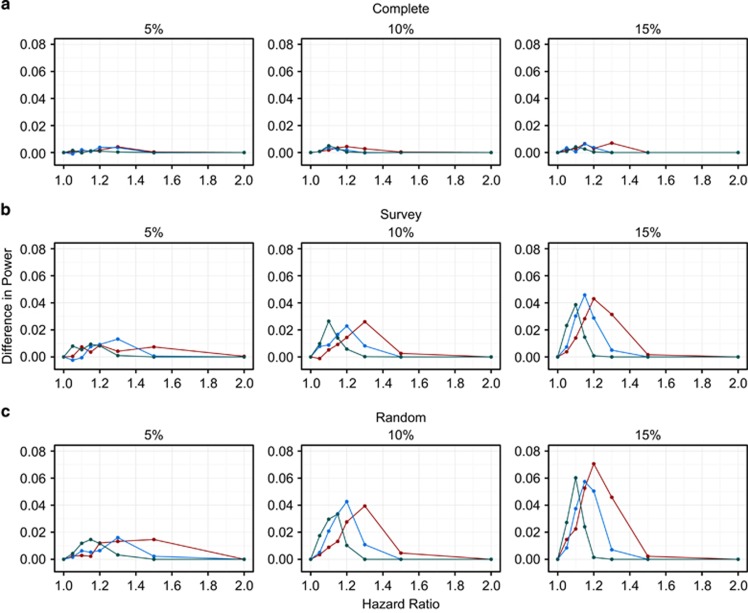
Figure 1.
Difference in power between the Cox and logistic regression models for an SNP with a risk allele frequency of 10% for the cohort study design. The red, blue and green lines represent the sample sizes 5000, 10 000 and 25 000, respectively. Complete (a), Survey (b) and Random (c) are the types of follow-up and 5, 10 and 15% are the cumulative disease incidences.

