Figure 1.
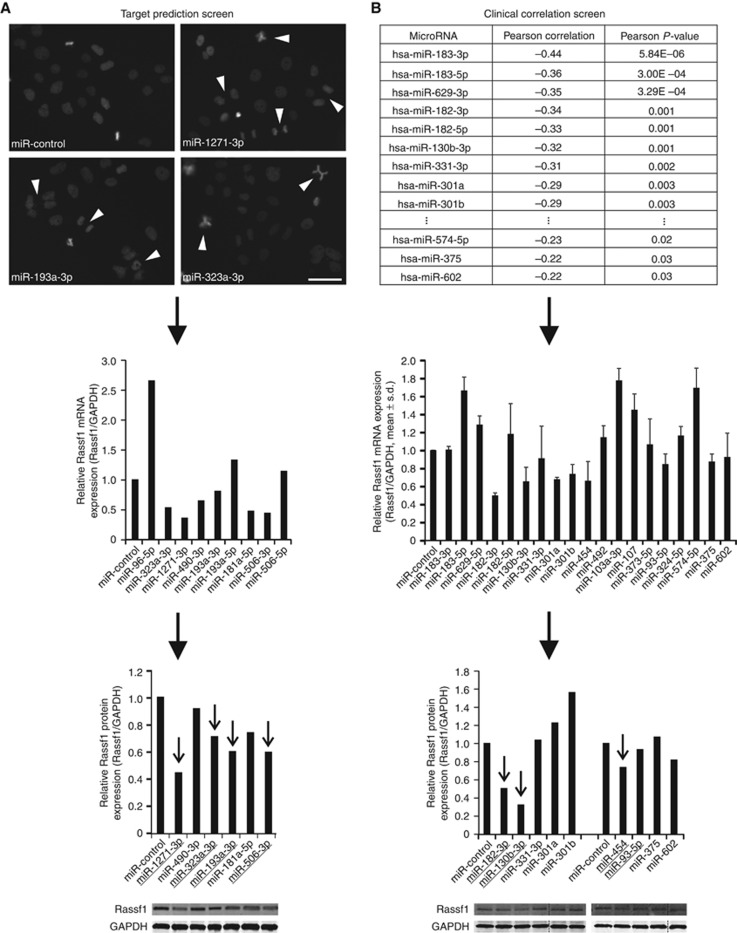
Identification of novel Rassf1-regulating miRNAs. Flowchart representations of the two screening approaches utilised. (A) The target prediction screen. Representative micrographs show mitotic anomalies induced by the overexpressed miRNAs. Scale bar is 50 μm. Arrowheads point to examples of detected mitotic defects, such as lagging chromosomes, chromatin bridges and multipolar mitotic spindles. Suppression of Rassf1 mRNA and protein expression by the most potent miRNAs is shown below. (B) The clinical correlation screen. The table shows the Pearson correlations and P-values of the most potent miRNAs (n=19) with RASSF1 mRNA expression in a breast tumour sample set. Results from Rassf1 qRT–PCR and immunoblotting experiments with these miRNAs are shown below. The target prediction screen (A) yielded four and the clinical correlation screen (B) three hit miRNAs that are marked with arrows in the graphs. The data are from one or two experiments (mean±s.d.).

