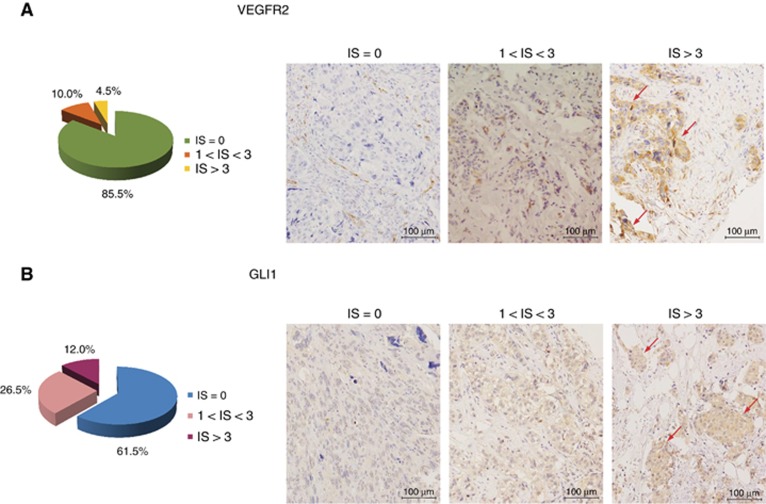
Figure 1.
GLI1 expression correlates with VEGFR2 in TNBC patients. (A) Left, pie chart representing the percentage of samples included in the TMA that show immunoreactive score (IS) equal to 0, 1<IS<3 and IS>3 for VEGFR2 expression. Right, immunoistochemical images representing VEGFR2 negative (IS=0) or -positive tumours with moderate (1<IS<3) and high (IS>3) expression levels, respectively. Endothelial cells positivity represents internal control (× 20 magnification). The red arrows indicate representative highly VEGFR2 positive signal. (B) Left, pie chart representing the percentage of samples included in the TMA that show IS equal to 0, 1<IS<3 and IS>3 for GLI1 expression, respectively. Right, immunoistochemical images representing GLI1-negative (IS=0) or -positive tumours with moderate (1<IS<3) or high (IS>3) expression levels, respectively (× 20 magnification). The red arrows indicate representative highly GLI1 positive signal.

