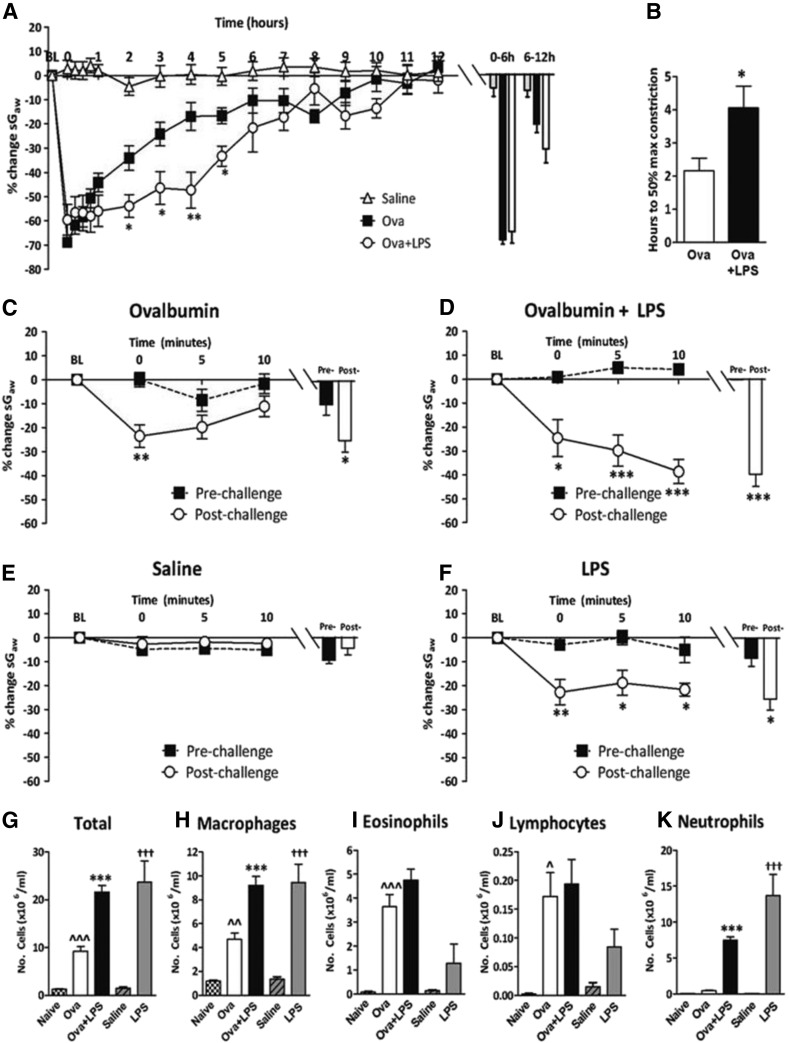
Fig. 2.
Guinea pigs were sensitized with Ova and challenged with Ova or saline alone or Ova + LPS, or unsensitized guinea pigs were challenged with LPS. (A) Mean time courses for changes in sGaw. Histograms represent the maximum bronchoconstriction values recorded during the EAR (0–6 hours) and LAR (6–12 hours); mean changes in sGaw are expressed as mean ± S.E.M. percent change from baseline before Ova challenge. (B) Analysis of the time taken for EAR to recover to 50% of peak bronchoconstriction values. (C and F) Response of the airways to nebulized histamine (0.3 mM, 2 minutes) 24 hours before and 24 hours after (C) Ova and (D) Ova + LPS challenge; (E) the second saline challenge; (F) the second LPS challenge. Histograms represent the mean peak response (G) total cell, (H) macrophage, (I) eosinophil, (J) lymphocyte, and (K) neutrophil counts in bronchoalveolar fluid. Naïve (unsensitized and unchallenged) groups are also shown for comparative purposes only; n = 6 or 7. *Significantly different from Ova challenge or prehistamine challenge where appropriate, P < 0.05; ** P < 0.01; ***P < 0.001; ^^significantly different from naïve, P < 0.01, ^^^ P < 0.001; †††Significantly different from saline, P < 0.001; performed with a two-tailed t test or one-way ANOVA, followed by Bonferroni or Kruskal-Wallis ANOVA post-test where appropriate.

