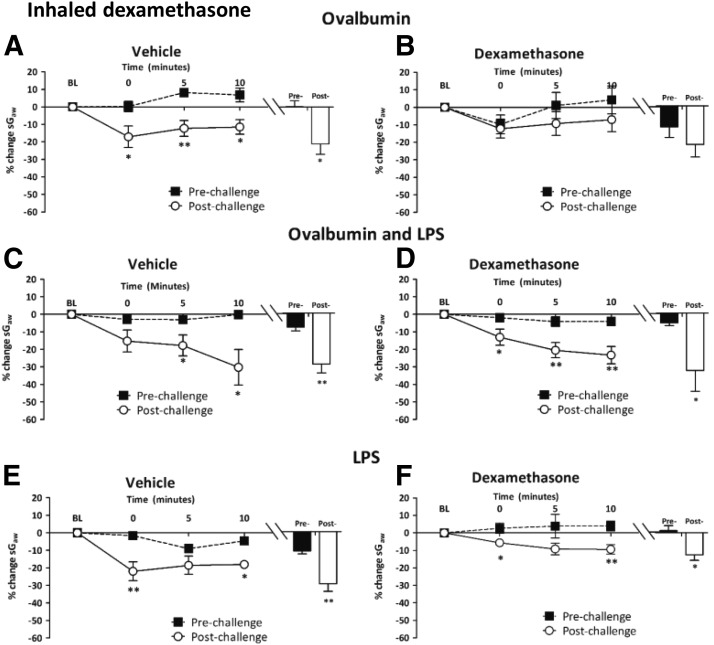
Fig. 6.
Responses of airways to nebulized histamine delivered in a plethysmograph (0.3 mM, 2 minutes) to guinea pigs (A and B) sensitized and challenged with Ova and treated with twice-daily inhaled (A) vehicle or (B) dexamethasone (20 mg/ml); (C and D) sensitized and challenged with Ova + LPS and treated with twice-daily inhaled (C) vehicle or (D) dexamethasone (20 mg/ml); (E and F) nonsensitized and challenged with LPS and treated with once-daily inhaled (E) vehicle or (F) dexamethasone 20 mg/ml. Histograms represent the mean peak response to histamine before and after Ova, Ova + LPS, or LPS challenge. Mean changes in sGaw are expressed as mean ± S.E.M. percent change from baseline. A negative value represents a bronchoconstriction. n = 6 or 7. *Significantly different from vehicle treatment, P < 0.05; **P < 0.01; ***P < 0.001; performed with a two-tailed t test.

