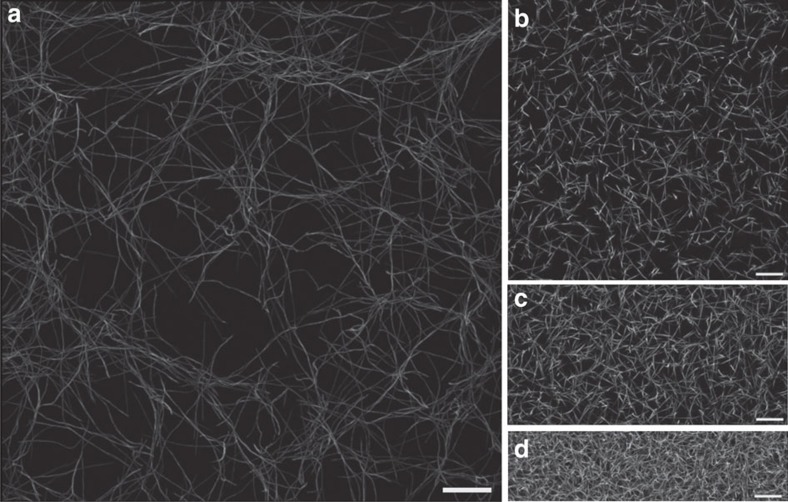
Figure 1. Experimental fibre networks.
(a–d) Reconstituted biopolymer networks considered throughout our analysis. Images show maximum intensity projection of three-dimensional confocal microscopy data obtained from polymerized (a) collagen type-I monomers at 0.2 mg ml−1 and (b) fibrinogen monomers at 0.2 mg ml−1, (c) 0.8 mg ml−1, and (d) 1.6 mg ml−1 (see Methods section for details of experimental procedure). Scale bars correspond to 25 μm.

