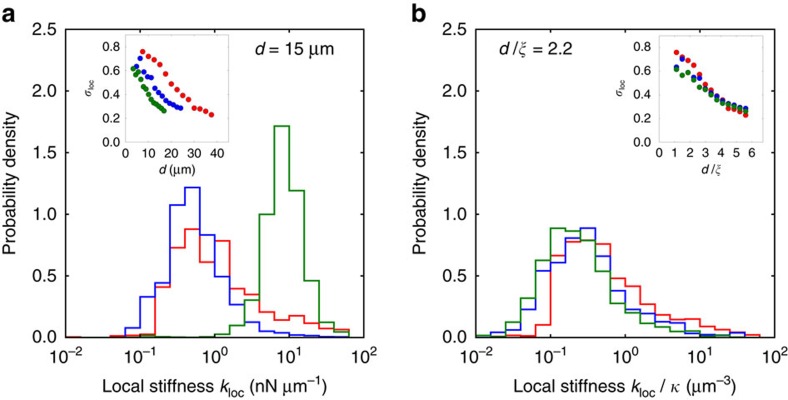
Figure 3. Varying concentration reveals universality of the local stiffness distribution.
(a) Distribution of local stiffnesses kloc, at force dipole length d∼15 μm, for fibrin networks with concentrations c=0.2 mg ml−1 (red), c=0.8 mg ml−1, (blue) and c=1.6 mg ml−1 (green). Inset shows geometric s.d. σloc versus force dipole length d. (b) Distribution of local stiffnesses kloc/κ scaled by the bending modulus, obtained by fitting model parameters for each experimental network using data from macroscopic rheology, at scaled force dipole length  , where
  is the mesh size, for fibrin networks with same concentrations as in a. Inset shows geometric s.d. σloc versus scaled force dipole length
  .
.

