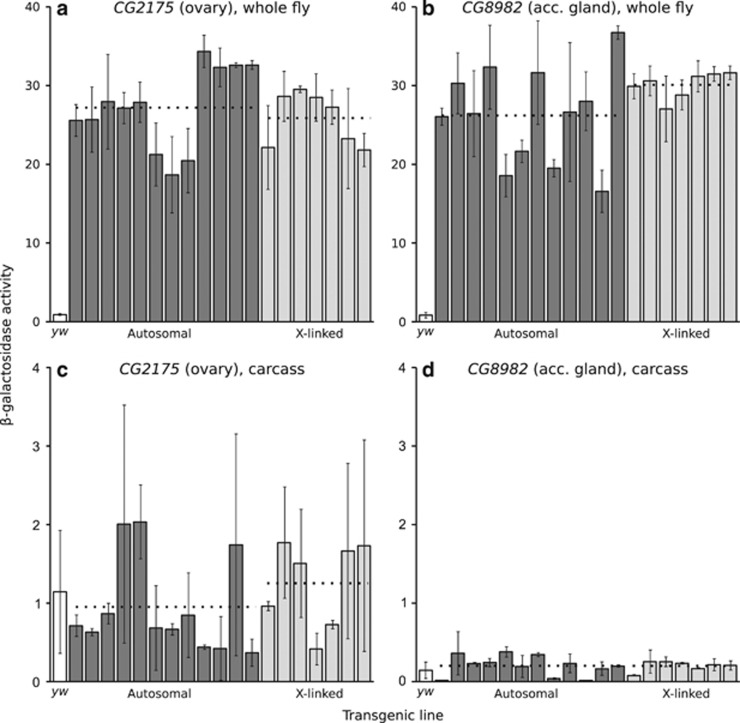
Figure 3.
Reporter gene expression of the ovary-specific (a, c) and accessory gland-specific (b, d) constructs in whole fly and in carcass. Each bar represents a transformed line with the reporter gene inserted at a unique autosomal (dark) or X-linked (light) location. The white bar indicates the activity of the control yw (non-transgenic) strain. Expression was measured spectrophotometrically as β-galactosidase activity in units of mOD min−1. Error bars indicate the standard deviation across biological replicates. Dotted lines indicate the average activities of all autosomal or X-linked lines. There was not a significant difference between autosomal and X-linked expression for either construct in whole flies (Wilcoxon's test; P=0.84 for CG2175, P=0.17 for CG8982) or in carcasses (P=0.34 for CG2175, P=0.90 for CG8982).

