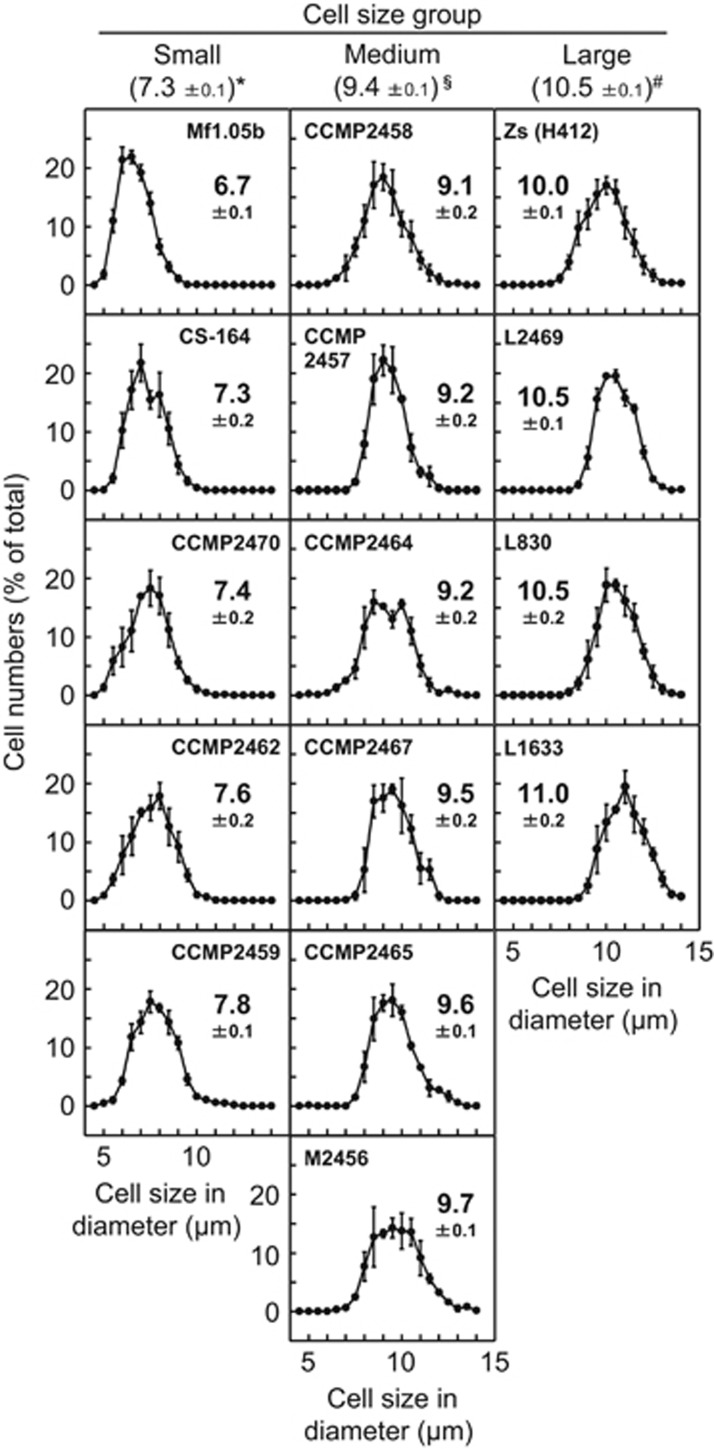
Figure 1.
Distribution of cell size in cultured Symbiodinium strains. The diameter of individual cells of each strain was measured with an automated cell counter (>100 cells in each measurement) and plotted as a percentage of the total sampled population. Numbers besides the plot in each panel show the average cell diameter (μm)±s.e. (n=3). Numbers below the Symbiodinium cell size group headings show the average cell diameter (μm)±s.e. for all strains in that group. Different symbols (*, § and #) indicate significant difference (P<0.01) between groups.

