Figure 2.
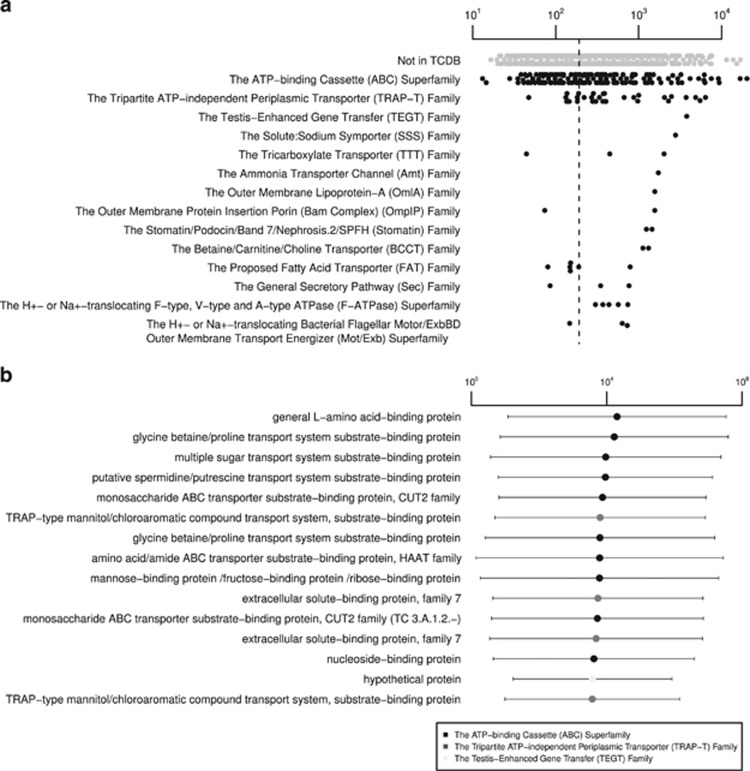
Most expressed CcPhy genes related to membrane transport. (a) CDS assigned to TCDB were grouped by families and super families. Groups were ordered according to maximum TPMav values (x axis), and only the top 15 are shown. For reference, CDS not classified by TCDB are shown (not in TCDB). The median of all expressed genes is represented by the dashed line. (b) Most expressed transport-related genes. Gray scale refer to gene family or superfamily. Genes are ordered according to TPMav values (x axis). Whiskers represent s.d. of biological replicates (n=3).

