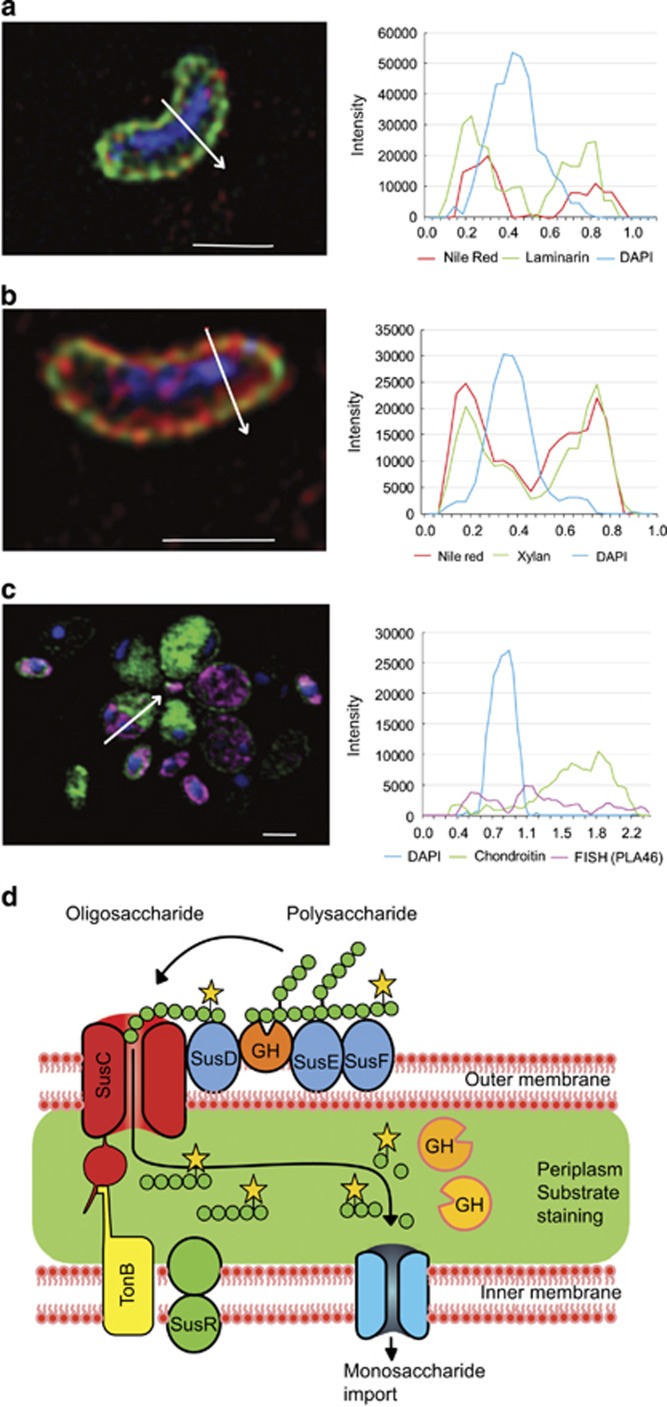
Figure 3.
SR-SIM images showing Sus-like uptake of FLA-PS and fluorescence intensity line profiles localising substrate-specific staining after 6 days of incubation. (a and b) Cells stained with FLA-PS (green), nile red (red; membrane) and DAPI (blue; DNA). White arrows indicate sections along which the fluorescence intensity line profiles were recorded. Scale bars=1 μm. Corresponding profiles indicating co-localisation of substrate and membrane are shown on the right. (a) Bacteroidetes cell from the Northern Temperate station stained with FLA-laminarin. (b) Bacteroidetes cell from the Southern Temperate station stained with FLA-xylan. (c) Planctomycetes cells from the Southern Temperate station stained with FLA-chondroitin. Cells were identified using the FISH probe PLA46 (magenta), which labels the riboplasm; the substrate staining is in the paryphoplasm. (d) Conceptual model of sus-like bacterial uptake of FLA-PS into the periplasm via TonB-dependent outer membrane transporters, causing halo-like staining in periplasm (green). The large oligosaccharides are further hydrolysed within the periplasm to monosaccharides, disaccharides or trisaccharides, which are subsequently transported into the cytoplasm. Modified after Koropatkin et al. (2012). ‘GH’ represents glycoside hydrolases.

