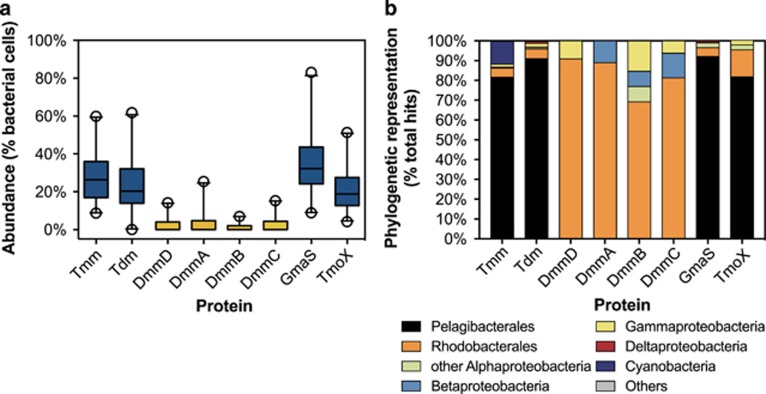
Figure 6.
Distribution of genes encoding proteins for MA metabolism in selected marine metagenomes. (a) Abundance of selected genes in marine bacteria, and (b) their phylogenetic affiliation. In the box-whisker plot whiskers represent the 5 and 95 percentiles and the line corresponds to the median. Circles represent outliers with all high-range outliers of Tmm, Tdm, GmaS and TmoX deriving from the same Sargasso Sea metagenome sample (Supplementary Table S4). The phylogenetic composition represents the normalized relative abundances of MA-degrading genes using metagenomes primarily retrieved from the global ocean sampling (GOS) data set (Rusch et al., 2007) (see Supplementary Table S4). Abbreviations are as described in Figure 1.

