Figure 1.
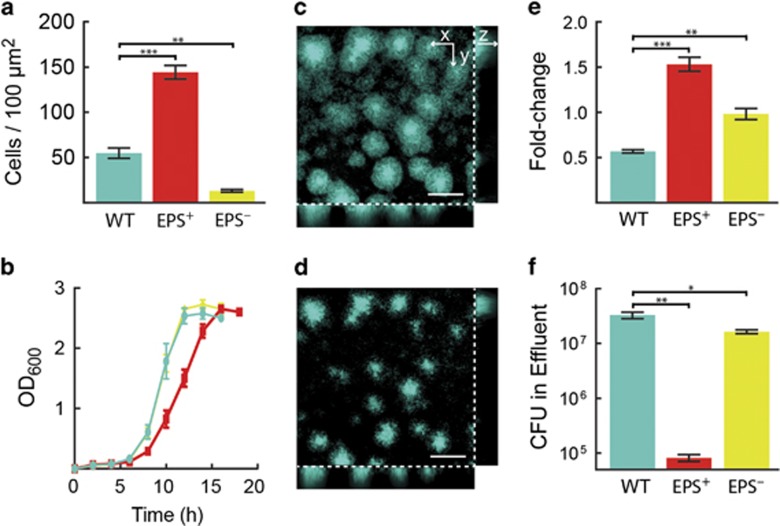
Growth characteristics of WT, EPS+ and EPS– V. cholerae strains. In all panels, WT is teal, EPS+ is red and EPS− is yellow. n=4 biological replicates for all experiments. (a) Number of biofilm cells per unit area of all strains after 16 h growth under biofilm-forming conditions. (b) Growth curves in shaken liquid culture. (c and d) Representative confocal images of biofilms formed by WT V. cholerae cells constitutively expressing mTFP1, before (c) and after (d) nutrient limitation for 2 h. The cross-sectional xy-view at 3 μm above the surface is shown in the upper left large panel and two orthogonal z-projections are shown on the bottom and right. Scale bar: 50 μm. (e) Fold-change in biofilm cell counts after 2 h nutrient limitation. (f) Colony-forming units (CFU) in the effluents collected immediately after the nutrient limitation period. Data are represented as mean±s.e.m. All statistical comparisons are unpaired t-tests. *** denotes P<0.0005, ** denotes P<0.005, and * denotes P<0.05.

