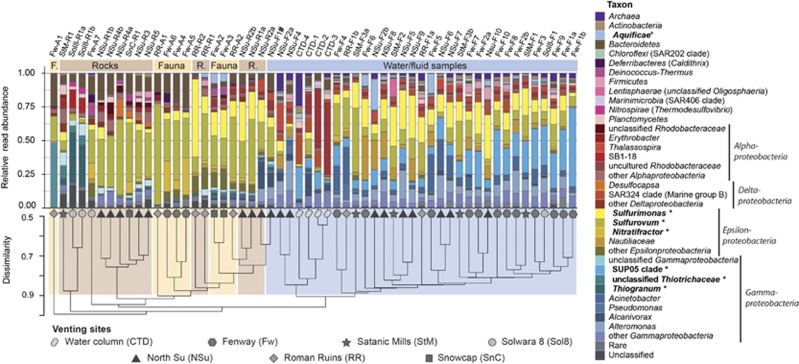
Figure 1.
Relative abundances of 16S rRNA gene sequence reads according to their classification. Putative SOB are denoted in bold and are marked with a ‘*’. The cluster dendrogram depicts the average linkage hierarchical clustering based on a Bray-Curtis dissimilarity matrix of community compositions resolved down to MED-node level. #Co-sampling of sediment particles possible.

