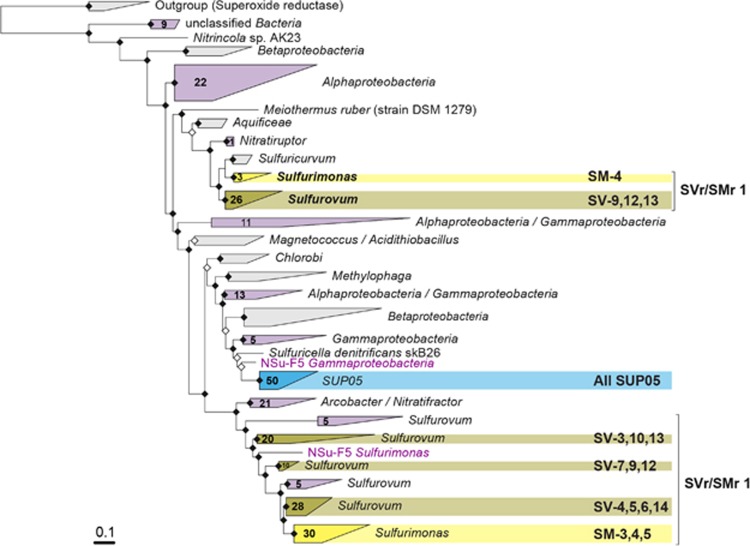
Figure 4.
Maximum likelihood tree of SoxY amino-acid sequences. In yellow—clusters containing epsilonproteobacterial bins, in blue—SUP05 bins, with respective bins indicated on the right. In purple—clusters containing other sequences encoded in the bulk metagenome assemblies. Numbers on the triangles indicate numbers of SoxY sequences from the bulk metagenome assemblies contained in the cluster. The tree was calculated with PhyML (Guindon et al., 2010) based on positions conserved in at least 25% of the sequences.

