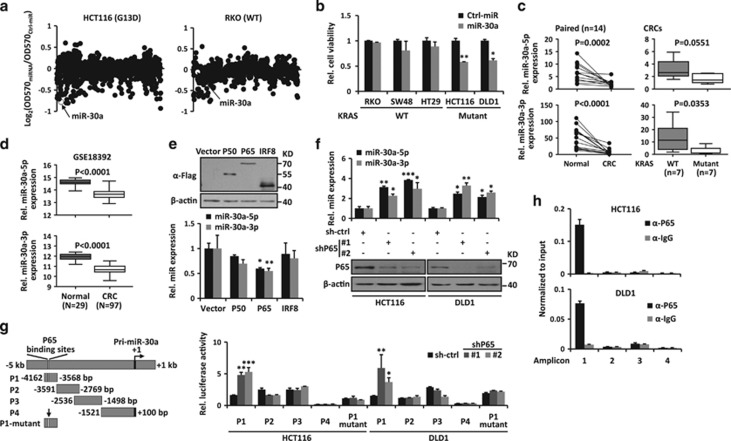
Figure 1.
miR-30a is downregulated and repressed by P65 in CRC cells. (a) High-content functional library screening results of miRNAs in HCT116 and RKO cells. miR-30a is indicated in hollow dot. (b) The effects of miR-30a on growth of indicated KRAS WT and -mutant cancer cells. (c) Expression levels of miR-30a-5p/3p were measured by RT-qPCR in paired colorectal tissues (left). Data from CRC tissues was showed as WT versus mutant KRAS group (Mut) according to their KRAS status (right). (d) Expression levels of miR-30a-5p/3p were analyzed from public available GSE18392 data set. (e) Upper: overexpression of P50, P65 and IRF8 was detected by immunoblot in HEK-293 cells. Lower: expression levels of miR-30a-5p/3p were determined by RT-qPCR. (f) Upper: P65 suppression elevated miR-30a-5p/3p expression. Lower: P65 knockdown by shRNA was confirmed by immunoblot in HCT116 and DLD1 cells. β-actin was used as the loading control. (g) Left: schematic diagram of miR-30a promoter. miR-30a promoter is divided into four fragments and the first fragment (P1) contains predicted P65-binding sites. The mutant P65-binding sites were indicated by a vertical arrow. Right: luciferase activity in HCT116 and DLD1 cells transfected with miR-30a promoter reporter and P65 shRNA-expressing vector or control vector. (h) ChIP assay was performed in HCT116 and DLD1 cells. Enrichment of each amplicon was detected by qPCR. Data are shown as the means±S.D. *P<0.05, **P<0.01, ***P<0.001

