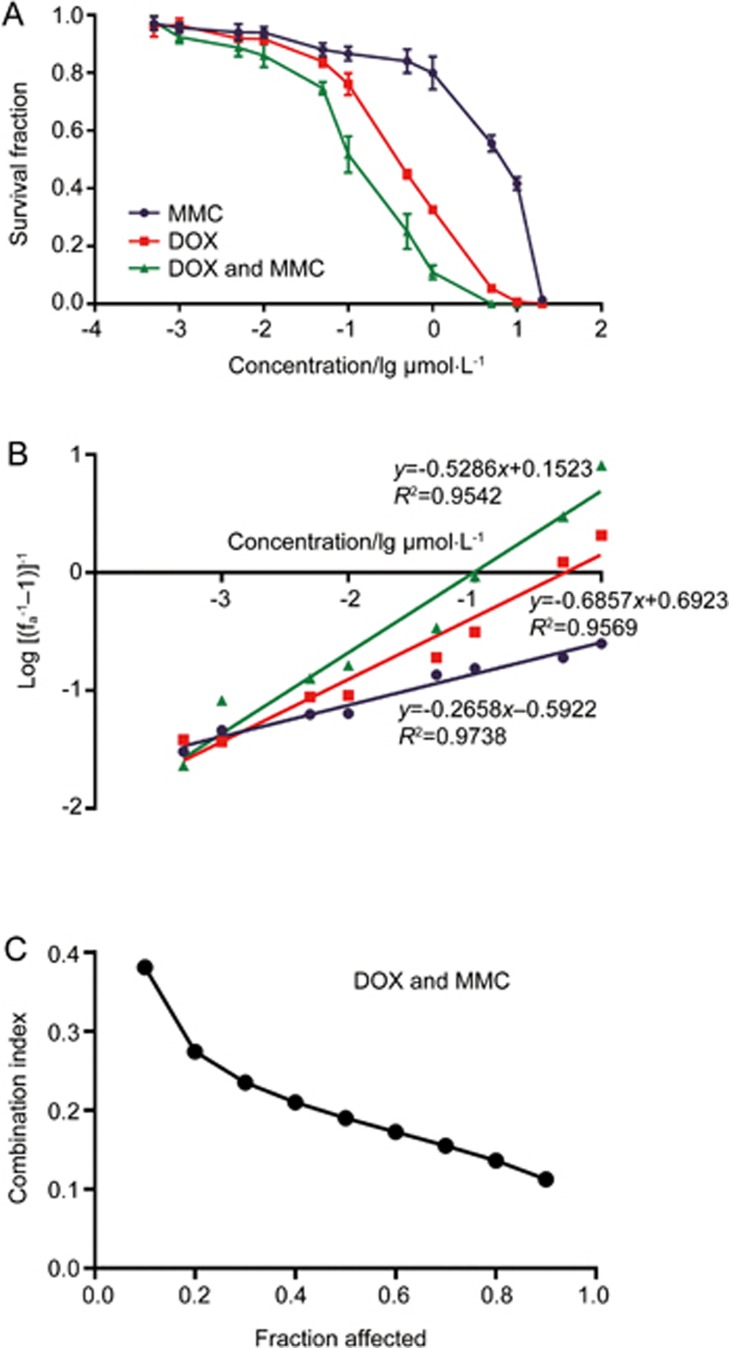
Figure 1.
Evaluation of synergism between DOX and MMC in MDA-MB-231 cells. (A) Dose-response curve for the ability of cells to form colonies after treatment exposure of MMC and DOX, alone and in combination at DOX/MMC molar ratio of 1:0.7 (Drug: 0.0005–20 μmol/L) for 1 h. The [Drug] for DOX/MMC combination is represented by the concentration of DOX. Data are presented as mean±SEM. n=6. (B) Median effect plot for MMC and DOX, alone and in combination. Dm and m were calculated from x-intercept and slope, respectively. (C) Combination index (CI) analysis of the interaction of MMC and DOX.

