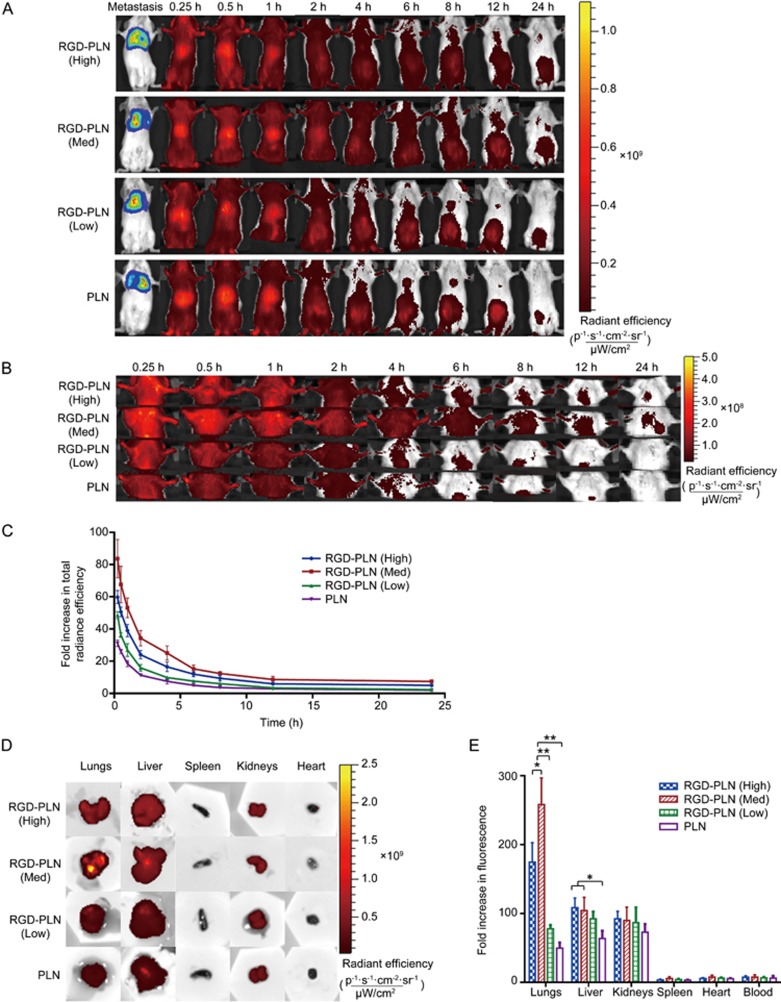
Figure 3.
Fluorescent imaging of ICG labelled nanoparticle biodistributions in the MDA-MB 231-luc-D3H2LN lung metastasis SCID model of TNBC. (A) Whole body biodistribution images up to 24 h using Xenogen IVIS Spectrum System 100 with Ex: 745 nm and Em: 820 nm. (B) Zoomed in images of the accumulation of NPs in the lungs up to 24 h. (C) Quantitative presentation of nanoparticle biodistribution in lung region up to 24 h. (D) Qualitative presentation of organ biodistribution ex vivo at 4 h. (E) Quantitative presentation of ex vivo organ biodistribution at 4 h. The data are represented as mean±SD. n=3. *P<0.05, **P<0.01.

